\n
## Line Chart: Loss Value Comparison Across Tasks
### Overview
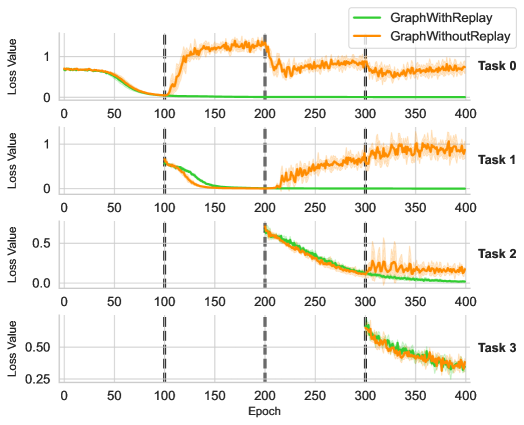
The image displays a series of four line charts arranged vertically, comparing the training loss of two different methods ("GraphWithReplay" and "GraphWithoutReplay") across four sequential tasks (Task 0, Task 1, Task 2, Task 3). The charts track the "Loss Value" over "Epochs" from 0 to 400. Vertical dashed lines at epochs 100, 200, and 300 likely indicate the boundaries or start points for new tasks.
### Components/Axes
* **Chart Type:** Multi-panel line chart with shaded confidence intervals or variance bands.
* **Legend:** Located in the top-right corner of the topmost chart (Task 0).
* **Green Line:** Labeled "GraphWithReplay".
* **Orange Line:** Labeled "GraphWithoutReplay".
* **X-Axis (Common to all panels):** Labeled "Epoch". Major tick marks are at 0, 50, 100, 150, 200, 250, 300, 350, 400.
* **Y-Axis (Per panel):** Labeled "Loss Value". The scale varies by task:
* **Task 0:** 0 to 1 (ticks at 0, 0.5, 1).
* **Task 1:** 0 to 1 (ticks at 0, 0.5, 1).
* **Task 2:** 0.0 to 0.5 (ticks at 0.0, 0.25, 0.5).
* **Task 3:** 0.25 to 0.50 (ticks at 0.25, 0.50).
* **Panel Labels:** Each subplot is labeled on the right side: "Task 0", "Task 1", "Task 2", "Task 3".
* **Vertical Reference Lines:** Dashed grey lines at Epochs 100, 200, and 300, spanning all four panels.
### Detailed Analysis
**Task 0 (Top Panel):**
* **GraphWithReplay (Green):** Starts at ~0.7, decreases smoothly to near 0 by epoch 100, and remains flat at ~0 for the remainder.
* **GraphWithoutReplay (Orange):** Starts at ~0.7, decreases to near 0 by epoch 100. After epoch 100, it spikes dramatically to a peak of ~1.2 around epoch 150, then gradually decreases but remains noisy and elevated, ending at ~0.7 by epoch 400.
* **Trend Verification:** Green shows stable convergence. Orange shows catastrophic forgetting or instability after the first task boundary (epoch 100).
**Task 1 (Second Panel):**
* **GraphWithReplay (Green):** Data begins at epoch 100. Starts at ~0.7, decreases smoothly to near 0 by epoch 200, and remains flat.
* **GraphWithoutReplay (Orange):** Data begins at epoch 100. Starts at ~0.7, decreases to near 0 by epoch 200. After epoch 200, it begins to rise steadily and noisily, reaching ~0.9 by epoch 400.
* **Trend Verification:** Green again shows stable convergence on the new task. Orange shows initial learning followed by significant performance degradation after the next task starts (epoch 200).
**Task 2 (Third Panel):**
* **GraphWithReplay (Green):** Data begins at epoch 200. Starts at ~0.6, decreases steadily to ~0.05 by epoch 400.
* **GraphWithoutReplay (Orange):** Data begins at epoch 200. Starts at ~0.6, decreases to ~0.1 by epoch 400, but exhibits much higher variance (wider shaded band) compared to the green line, especially after epoch 300.
* **Trend Verification:** Both methods show a decreasing trend on this task. Green is smoother and reaches a lower final loss. Orange is noisier.
**Task 3 (Bottom Panel):**
* **GraphWithReplay (Green):** Data begins at epoch 300. Starts at ~0.55, decreases to ~0.35 by epoch 400.
* **GraphWithoutReplay (Orange):** Data begins at epoch 300. Starts at ~0.55, decreases to ~0.35 by epoch 400, again with noticeably higher variance than the green line.
* **Trend Verification:** Both methods show a similar decreasing trend and final value, but the replay method (green) is more stable.
### Key Observations
1. **Catastrophic Forgetting:** The "GraphWithoutReplay" method (orange) shows severe performance degradation on earlier tasks (Task 0, Task 1) after new tasks are introduced (at epochs 100 and 200). Its loss increases significantly.
2. **Stability from Replay:** The "GraphWithReplay" method (green) maintains low, stable loss on previous tasks after new ones are introduced. It successfully mitigates catastrophic forgetting.
3. **Variance:** The orange line consistently shows higher variance (wider shaded area) than the green line, indicating less stable training.
4. **Task Difficulty:** The initial loss values and convergence slopes differ across tasks, suggesting varying difficulty. Task 2 and 3 start at lower loss values than Task 0 and 1.
### Interpretation
This visualization demonstrates the effectiveness of a "replay" mechanism in a continual or sequential learning setting. The core problem illustrated is **catastrophic forgetting**, where a neural network ("GraphWithoutReplay") forgets previously learned tasks upon learning new ones.
* **What the data suggests:** The "GraphWithReplay" method successfully retains knowledge from Task 0 and Task 1 while learning Tasks 2 and 3, as evidenced by its flat, low loss lines after task boundaries. In contrast, the baseline method's performance on old tasks deteriorates sharply as soon as a new task begins.
* **How elements relate:** The vertical dashed lines are critical, acting as event markers. The divergence between the green and orange lines immediately after these markers (especially at epochs 100 and 200) is the primary evidence for the replay method's benefit. The y-axis scale change for Tasks 2 and 3 indicates these tasks may be inherently easier or have a different loss landscape.
* **Notable anomalies:** The dramatic spike in Task 0 loss for the orange line after epoch 100 is a stark anomaly, showing not just forgetting but active interference. The increasing noise in the orange line for Task 2 after epoch 300 suggests instability propagates even to the current task.
* **Underlying message:** The charts argue that without a mechanism to preserve old knowledge (like replay), sequential learning is unstable and leads to forgetting. The replay method provides stability, lower variance, and prevents performance collapse on prior tasks.