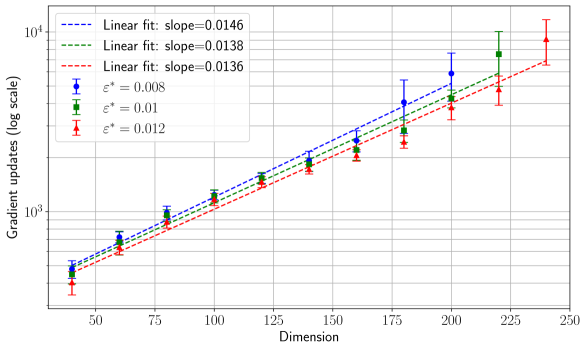
## Log-Linear Plot: Gradient Updates vs. Dimension
### Overview
The image is a log-linear plot showing the relationship between "Gradient updates (log scale)" on the y-axis and "Dimension" on the x-axis. There are three data series, each representing a different value of epsilon star (ε*): 0.008 (blue circles), 0.01 (green squares), and 0.012 (red triangles). Each data series also has a linear fit line. Error bars are present on each data point.
### Components/Axes
* **X-axis:** Dimension, ranging from 50 to 250 in increments of 25.
* **Y-axis:** Gradient updates (log scale), ranging from 10^3 to 10^4. The y-axis is logarithmic.
* **Legend (top-left):**
* Blue dashed line: Linear fit: slope=0.0146
* Green dashed line: Linear fit: slope=0.0138
* Red dashed line: Linear fit: slope=0.0136
* Blue circle: ε* = 0.008
* Green square: ε* = 0.01
* Red triangle: ε* = 0.012
### Detailed Analysis
* **ε* = 0.008 (Blue Circles):** The data points generally increase with dimension.
* Dimension 50: Gradient updates ~ 400
* Dimension 75: Gradient updates ~ 700
* Dimension 100: Gradient updates ~ 800
* Dimension 125: Gradient updates ~ 1300
* Dimension 150: Gradient updates ~ 1700
* Dimension 175: Gradient updates ~ 2500
* Dimension 200: Gradient updates ~ 4000
* Dimension 225: Gradient updates ~ 5000
* Linear fit slope: 0.0146
* **ε* = 0.01 (Green Squares):** The data points generally increase with dimension.
* Dimension 50: Gradient updates ~ 350
* Dimension 75: Gradient updates ~ 650
* Dimension 100: Gradient updates ~ 800
* Dimension 125: Gradient updates ~ 1200
* Dimension 150: Gradient updates ~ 1600
* Dimension 175: Gradient updates ~ 2200
* Dimension 200: Gradient updates ~ 3200
* Dimension 225: Gradient updates ~ 4500
* Linear fit slope: 0.0138
* **ε* = 0.012 (Red Triangles):** The data points generally increase with dimension.
* Dimension 50: Gradient updates ~ 300
* Dimension 75: Gradient updates ~ 600
* Dimension 100: Gradient updates ~ 700
* Dimension 125: Gradient updates ~ 1100
* Dimension 150: Gradient updates ~ 1400
* Dimension 175: Gradient updates ~ 2000
* Dimension 200: Gradient updates ~ 2800
* Dimension 225: Gradient updates ~ 4000
* Linear fit slope: 0.0136
### Key Observations
* All three data series show an increasing trend of gradient updates with increasing dimension.
* The slopes of the linear fits are very similar, with the slope for ε* = 0.008 being slightly higher (0.0146) than the other two (0.0138 and 0.0136).
* The error bars appear to increase in size as the dimension increases, suggesting greater variability in gradient updates at higher dimensions.
* For a given dimension, a lower value of ε* generally results in higher gradient updates.
### Interpretation
The plot suggests that the number of gradient updates required increases approximately exponentially with the dimension of the problem, as indicated by the log-linear scale. The different values of ε* seem to influence the magnitude of the gradient updates, with smaller ε* values leading to slightly higher gradient updates. The increasing error bars with dimension might indicate that the optimization process becomes more sensitive or unstable as the problem size grows. The slopes of the linear fits are close, suggesting a similar rate of increase in gradient updates with dimension across the different ε* values.