## Line Charts: Learning Method Comparison
### Overview
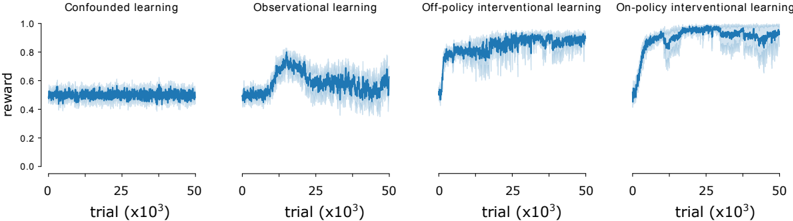
The image presents four line charts comparing different learning methods: Confounded learning, Observational learning, Off-policy interventional learning, and On-policy interventional learning. Each chart displays the reward obtained over trials (x10^3). The y-axis represents the reward, ranging from 0.0 to 1.0. The x-axis represents the trial number, ranging from 0 to 50 (x10^3). The data is represented by a blue line with a lighter blue shaded area indicating the variance or confidence interval.
### Components/Axes
* **Titles (Top):**
* Confounded learning
* Observational learning
* Off-policy interventional learning
* On-policy interventional learning
* **Y-axis Label (Left):** reward
* **Y-axis Scale (Left):** 0.0, 0.2, 0.4, 0.6, 0.8, 1.0
* **X-axis Label (Bottom):** trial (x10^3)
* **X-axis Scale (Bottom):** 0, 25, 50
### Detailed Analysis
**1. Confounded Learning:**
* **Trend:** The reward remains relatively constant over the trials.
* **Values:** The reward fluctuates around 0.5, with a range of approximately 0.4 to 0.6.
**2. Observational Learning:**
* **Trend:** The reward initially increases, peaks around trial 15, and then decreases and stabilizes.
* **Values:** The reward starts around 0.5, rises to approximately 0.75, and then settles around 0.6.
**3. Off-policy Interventional Learning:**
* **Trend:** The reward increases sharply in the beginning and then stabilizes at a high level.
* **Values:** The reward starts near 0.5, rapidly increases to approximately 0.9, and then fluctuates around 0.9 with some variance.
**4. On-policy Interventional Learning:**
* **Trend:** The reward increases rapidly, overshoots, and then stabilizes at a high level.
* **Values:** The reward starts near 0.4, increases rapidly to approximately 0.95, dips slightly, and then fluctuates around 0.95 with some variance.
### Key Observations
* Confounded learning shows a stable but relatively low reward.
* Observational learning shows an initial improvement followed by a decline.
* Off-policy and On-policy interventional learning both achieve high rewards, but On-policy learning shows a more rapid initial increase.
### Interpretation
The charts suggest that interventional learning methods (both off-policy and on-policy) are more effective in achieving higher rewards compared to confounded and observational learning. On-policy interventional learning appears to have the fastest initial learning rate, but both off-policy and on-policy methods eventually converge to similar high reward levels. Confounded learning performs the worst, maintaining a low and stable reward. Observational learning shows some initial promise but ultimately plateaus at a lower reward than the interventional methods. The shaded areas indicate the variability in the rewards, which is generally higher in the interventional methods, especially during the initial learning phase.