\n
## Line Charts: Learning Curves for Four Different Learning Paradigms
### Overview
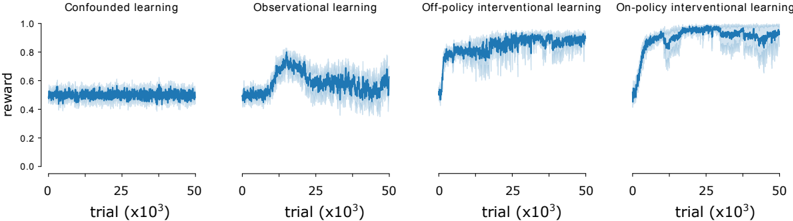
The image displays a series of four horizontally arranged line charts, each depicting the learning performance (measured by reward) over trials for a distinct learning method. The charts share identical axes, allowing for direct comparison. The overall trend suggests that interventional learning methods achieve higher and more stable rewards compared to confounded and observational methods.
### Components/Axes
* **Chart Type:** Four separate line charts with shaded regions (likely representing variance or confidence intervals).
* **Common Y-Axis (Vertical):**
* **Label:** `reward`
* **Scale:** Linear, ranging from `0.0` to `1.0`.
* **Markers:** Major ticks at `0.0`, `0.2`, `0.4`, `0.6`, `0.8`, `1.0`.
* **Common X-Axis (Horizontal):**
* **Label:** `trial (x10³)` (indicating trials are measured in thousands).
* **Scale:** Linear, ranging from `0` to `50` (representing 0 to 50,000 trials).
* **Markers:** Major ticks at `0`, `25`, `50`.
* **Panel Titles (from left to right):**
1. `Confounded learning`
2. `Observational learning`
3. `Off-policy interventional learning`
4. `On-policy interventional learning`
* **Data Series:** Each chart contains a single primary data series represented by a solid blue line, surrounded by a lighter blue shaded area indicating variability.
### Detailed Analysis
**1. Confounded learning (Leftmost panel):**
* **Trend:** The reward line is essentially flat, showing no significant upward or downward trend over the 50,000 trials.
* **Data Points:** The reward value fluctuates tightly around approximately `0.5` for the entire duration. The shaded variance region is narrow, suggesting consistent but mediocre performance.
**2. Observational learning (Second panel from left):**
* **Trend:** The reward shows an initial increase, peaks, and then declines, ending with high volatility.
* **Data Points:**
* Starts near `0.5`.
* Rises to a peak of approximately `0.8` around trial `15,000` (x=15).
* After the peak, the reward decreases and fluctuates significantly, ending in the range of `0.6` to `0.7` by trial `50,000`.
* The shaded variance region is notably wider than in the confounded learning chart, especially after the peak, indicating unstable performance.
**3. Off-policy interventional learning (Third panel from left):**
* **Trend:** Shows a rapid initial increase in reward, followed by a stable, high-performance plateau.
* **Data Points:**
* Starts near `0.5`.
* Increases sharply within the first `5,000` to `10,000` trials to reach a reward level of approximately `0.8`.
* Maintains a stable reward between `0.8` and `0.9` for the remainder of the trials (up to `50,000`).
* The shaded variance region is moderate, indicating reliable performance with some expected noise.
**4. On-policy interventional learning (Rightmost panel):**
* **Trend:** Exhibits the fastest and highest increase in reward, achieving near-optimal performance that is sustained.
* **Data Points:**
* Starts near `0.5`.
* Rises very steeply within the first `5,000` trials to exceed `0.9`.
* Quickly approaches and stabilizes near the maximum reward of `1.0` (approximately `0.95` to `1.0`) from around trial `10,000` onward.
* The shaded variance region is present but relatively narrow at the high reward level, indicating both high performance and good stability.
### Key Observations
1. **Performance Hierarchy:** There is a clear hierarchy in final performance: On-policy interventional > Off-policy interventional > Observational > Confounded learning.
2. **Learning Speed:** The interventional methods (both on-policy and off-policy) demonstrate much faster learning curves (steeper initial slopes) compared to the other two methods.
3. **Stability:** Confounded learning is stable but poor. Observational learning is unstable after an initial improvement. Both interventional methods show stable, high performance after learning.
4. **Peak vs. Plateau:** Observational learning reaches a distinct peak before degrading, while the interventional methods reach a plateau and maintain it.
### Interpretation
This set of charts provides strong visual evidence for the superiority of **interventional learning** paradigms over **confounded** and purely **observational** approaches in this specific context. The data suggests that actively intervening in the environment (whether on-policy or off-policy) leads to faster acquisition of a high-reward policy and more stable long-term performance.
* **Confounded learning's** flat line at ~0.5 reward indicates a fundamental inability to learn a useful policy, likely because the learning signal is corrupted by confounding factors.
* **Observational learning's** curve is telling: it can initially find a somewhat better policy (peak at ~0.8), but this policy is not robust or optimal, leading to performance degradation and high variance as trials continue. This suggests the agent is learning spurious correlations that do not hold over time.
* The **off-policy** and **on-policy interventional** methods succeed because they likely isolate causal relationships. The on-policy method's slightly faster rise and higher final plateau might indicate that learning from its own current policy (on-policy) is more efficient for this task than learning from a different policy (off-policy), though both are highly effective.
In essence, the charts argue that to achieve high, stable rewards in this learning scenario, the agent must be able to perform interventions that reveal causal structure, moving beyond mere observation of confounded data.