## Box Plot: Number of Goals by Agent Type
### Overview
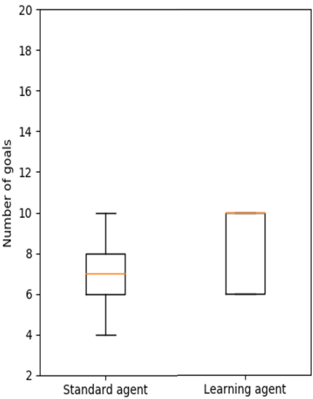
The image displays a comparative box plot analyzing the distribution of goals scored by two types of agents: "Standard agent" and "Learning agent." The y-axis represents the "Number of goals" (ranging from 2 to 20), while the x-axis categorizes the agents. The plot uses black boxes with orange median lines to represent data distributions.
### Components/Axes
- **Y-axis**: "Number of goals" (scale: 2 to 20, increments of 2).
- **X-axis**: Two categories: "Standard agent" (left) and "Learning agent" (right).
- **Legend**: No explicit legend is present. Colors are directly embedded in the plot (black boxes, orange median lines).
- **Whiskers**: Extend from the boxes to represent data range (minimum to maximum values excluding outliers).
### Detailed Analysis
1. **Standard Agent**:
- **Median**: Approximately 7 (orange line within the box).
- **Interquartile Range (IQR)**: Box spans from 6 (Q1) to 8 (Q3).
- **Whiskers**: Extend from 4 (minimum) to 10 (maximum).
- **Outliers**: None visible.
2. **Learning Agent**:
- **Median**: Approximately 8 (orange line within the box).
- **Interquartile Range (IQR)**: Box spans from 6 (Q1) to 10 (Q3).
- **Whiskers**: Extend from 6 (minimum) to 10 (maximum).
- **Outliers**: None visible.
### Key Observations
- The **Learning agent** exhibits a higher median goal count (8 vs. 7) and a larger IQR (4 vs. 2), indicating greater variability in performance.
- The **Standard agent** shows a tighter distribution, with data concentrated between 6 and 8 goals.
- Both agents share identical whisker ranges (4–10 for Standard; 6–10 for Learning), suggesting similar extreme values but differing central tendencies.
### Interpretation
The data suggests that the **Learning agent** outperforms the Standard agent on average, achieving a higher median goal count. However, the Learning agent’s performance is less consistent, as evidenced by its broader IQR. The Standard agent, while less effective overall, demonstrates more predictable outcomes. The absence of outliers in both groups implies stable performance under the tested conditions. This could indicate that the Learning agent’s adaptive mechanisms improve average results but introduce variability, whereas the Standard agent’s fixed strategy prioritizes consistency over optimization.