## Box Plot: Number of Goals Achieved by Standard and Learning Agents
### Overview
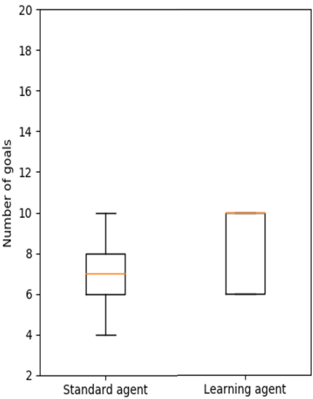
The image is a box plot comparing the number of goals achieved by a "Standard agent" and a "Learning agent." The plot displays the distribution of goals achieved by each agent, showing the median, quartiles, and range.
### Components/Axes
* **X-axis:** Categorical axis with two categories: "Standard agent" and "Learning agent."
* **Y-axis:** Numerical axis labeled "Number of goals," ranging from 2 to 20, with tick marks at intervals of 2.
* **Box Plots:** Each box plot represents the distribution of goals for each agent type. The box represents the interquartile range (IQR), the line inside the box represents the median, and the whiskers extend to the minimum and maximum values within 1.5 times the IQR.
### Detailed Analysis
* **Standard agent:**
* Minimum number of goals: Approximately 4
* First quartile (Q1): Approximately 6
* Median: Approximately 7
* Third quartile (Q3): Approximately 8
* Maximum number of goals: Approximately 10
* **Learning agent:**
* Minimum number of goals: Approximately 6
* First quartile (Q1): Approximately 6
* Median: Approximately 8
* Third quartile (Q3): Approximately 10
* Maximum number of goals: Approximately 10
### Key Observations
* The Learning agent has a higher median number of goals achieved compared to the Standard agent.
* The range of goals achieved by the Learning agent is smaller than that of the Standard agent.
* The interquartile range (IQR) for the Learning agent is higher than the Standard agent.
### Interpretation
The box plot suggests that the Learning agent tends to achieve a higher number of goals compared to the Standard agent. The smaller range for the Learning agent indicates more consistent performance. The higher IQR for the Learning agent suggests that the middle 50% of the data is more spread out than the Standard agent. Overall, the Learning agent appears to be more effective in achieving goals.