## Chart Type: Box Plot of Number of Goals for Different Agent Types
### Overview
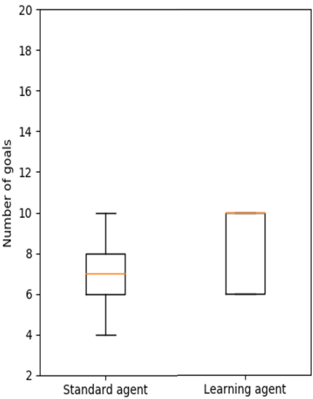
This image displays a box plot comparing the distribution of "Number of goals" achieved by two distinct agent types: a "Standard agent" and a "Learning agent". The chart uses a vertical axis for the number of goals and a horizontal axis to categorize the agent types.
### Components/Axes
* **Y-axis (Vertical Axis)**:
* **Title**: "Number of goals"
* **Scale**: Ranges from 2 to 20.
* **Tick Markers**: Labeled at intervals of 2 (2, 4, 6, 8, 10, 12, 14, 16, 18, 20).
* **X-axis (Horizontal Axis)**:
* **Categories**: Two distinct categories are presented:
* "Standard agent" (positioned on the left)
* "Learning agent" (positioned on the right)
* **Legend**: There is no explicit legend. The X-axis labels directly identify the data series represented by each box plot.
### Detailed Analysis
The chart presents two box plots, each representing the distribution of "Number of goals" for its respective agent type. Each box plot consists of a box, an internal line (median), and whiskers extending from the box.
1. **Standard agent (left box plot)**:
* **Visual Trend/Distribution**: This box plot shows a distribution of goals ranging from approximately 4 to 10. The central tendency (median) is lower than the learning agent, and its interquartile range is relatively narrow.
* **Median (orange line inside the box)**: Approximately 7 goals.
* **Interquartile Range (IQR - the box itself)**:
* **25th Percentile (Q1 - bottom of the box)**: Approximately 6 goals.
* **75th Percentile (Q3 - top of the box)**: Approximately 8 goals.
* **Whiskers**:
* **Lower Whisker (bottom line)**: Extends down to approximately 4 goals.
* **Upper Whisker (top line)**: Extends up to approximately 10 goals.
* **Range**: The data for the standard agent spans from approximately 4 goals to 10 goals.
2. **Learning agent (right box plot)**:
* **Visual Trend/Distribution**: This box plot shows a distribution of goals ranging from approximately 6 to 10. It has a higher median and a more compressed upper half of its distribution compared to the standard agent.
* **Median (orange line inside the box)**: Exactly 10 goals.
* **Interquartile Range (IQR - the box itself)**:
* **25th Percentile (Q1 - bottom of the box)**: Exactly 6 goals.
* **75th Percentile (Q3 - top of the box)**: Exactly 10 goals.
* **Whiskers**:
* **Lower Whisker (bottom line)**: Extends down to exactly 6 goals. This indicates that the minimum value is at the 25th percentile.
* **Upper Whisker (top line)**: Extends up to exactly 10 goals. This indicates that the maximum value is at the 75th percentile, which is also the median.
* **Range**: The data for the learning agent spans from approximately 6 goals to 10 goals.
### Key Observations
* The "Learning agent" generally achieves a higher number of goals than the "Standard agent".
* The median number of goals for the "Learning agent" (10 goals) is significantly higher than that for the "Standard agent" (approximately 7 goals).
* The "Learning agent" shows a tighter distribution in its upper half, with its median, 75th percentile, and maximum value all converging at 10 goals. This suggests that at least 50% of the "Learning agent" data points are at 10 goals.
* The "Standard agent" has a wider overall range (4 to 10 goals) compared to the "Learning agent" (6 to 10 goals), particularly at the lower end.
* Both agents share a similar lower quartile (Q1) at approximately 6 goals, indicating that at least 25% of the data for both agents falls below or at this value.
### Interpretation
The box plot clearly demonstrates a performance advantage for the "Learning agent" over the "Standard agent" in terms of the "Number of goals" achieved. The "Learning agent" consistently reaches a higher number of goals, with its median performance matching the maximum performance of the "Standard agent".
Specifically, the "Learning agent" achieves 10 goals in at least 50% of its trials (from the median to Q3, and also the maximum), while the "Standard agent" only reaches 10 goals at its absolute best performance (upper whisker). The "Standard agent" also exhibits a wider spread of outcomes, including instances where it achieves as few as 4 goals, which is lower than any outcome observed for the "Learning agent".
This data suggests that the "Learning agent" is not only more effective at achieving goals on average but also more consistent in its higher performance, with a significant portion of its outcomes clustered at the maximum observed goal count. The "Standard agent," while capable of reaching the same maximum, has a lower typical performance and a greater variability in its results. This could imply that the learning mechanism provides a more robust and optimized strategy for goal attainment.