\n
## Box Plot: Number of Goals Scored by Agent Type
### Overview
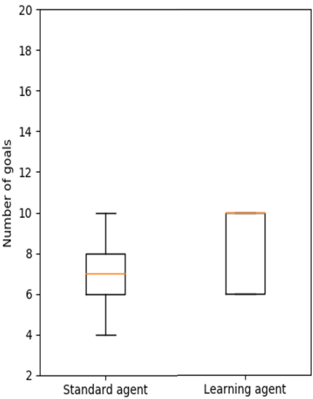
The image presents a box plot comparing the number of goals scored by two types of agents: a "Standard agent" and a "Learning agent". The plot displays the distribution of goal counts for each agent type, showing the median, quartiles, and potential outliers.
### Components/Axes
* **X-axis:** Agent Type - with categories "Standard agent" and "Learning agent".
* **Y-axis:** Number of goals - ranging from 2 to 20, with increments of 2.
* **Box Plots:** Two box plots, one for each agent type. Each box plot includes:
* A box representing the interquartile range (IQR).
* A horizontal line inside the box representing the median.
* "Whiskers" extending from the box, indicating the range of the data (excluding outliers).
* Potential outlier points beyond the whiskers.
### Detailed Analysis
**Standard Agent:**
The box plot for the Standard agent shows a median of approximately 7 goals. The box extends from approximately 5.5 to 8 goals, indicating the IQR. The whiskers extend down to approximately 4 goals and up to approximately 9 goals. There are no visible outliers.
**Learning Agent:**
The box plot for the Learning agent shows a median of approximately 9.5 goals. The box extends from approximately 7 to 10 goals, indicating the IQR. The whiskers extend down to approximately 6.5 goals and up to approximately 10 goals. There are no visible outliers.
### Key Observations
* The Learning agent appears to score more goals on average than the Standard agent, as indicated by the higher median.
* The distribution of goal counts for the Learning agent is more concentrated, as indicated by the smaller IQR.
* Both agents have similar ranges of goal counts, as indicated by the similar whisker lengths.
* There are no apparent outliers in either dataset.
### Interpretation
The data suggests that the Learning agent is more effective at scoring goals than the Standard agent. The higher median and more concentrated distribution of goal counts for the Learning agent indicate that it consistently scores more goals. This could be due to the Learning agent's ability to adapt and improve its performance over time, while the Standard agent's performance remains relatively constant. The lack of outliers suggests that both agents perform consistently within a certain range, without any extreme deviations. This data could be used to evaluate the effectiveness of the learning algorithm used by the Learning agent and to identify areas for improvement in the Standard agent's strategy.