## Diagram: LLM Pipeline
### Overview
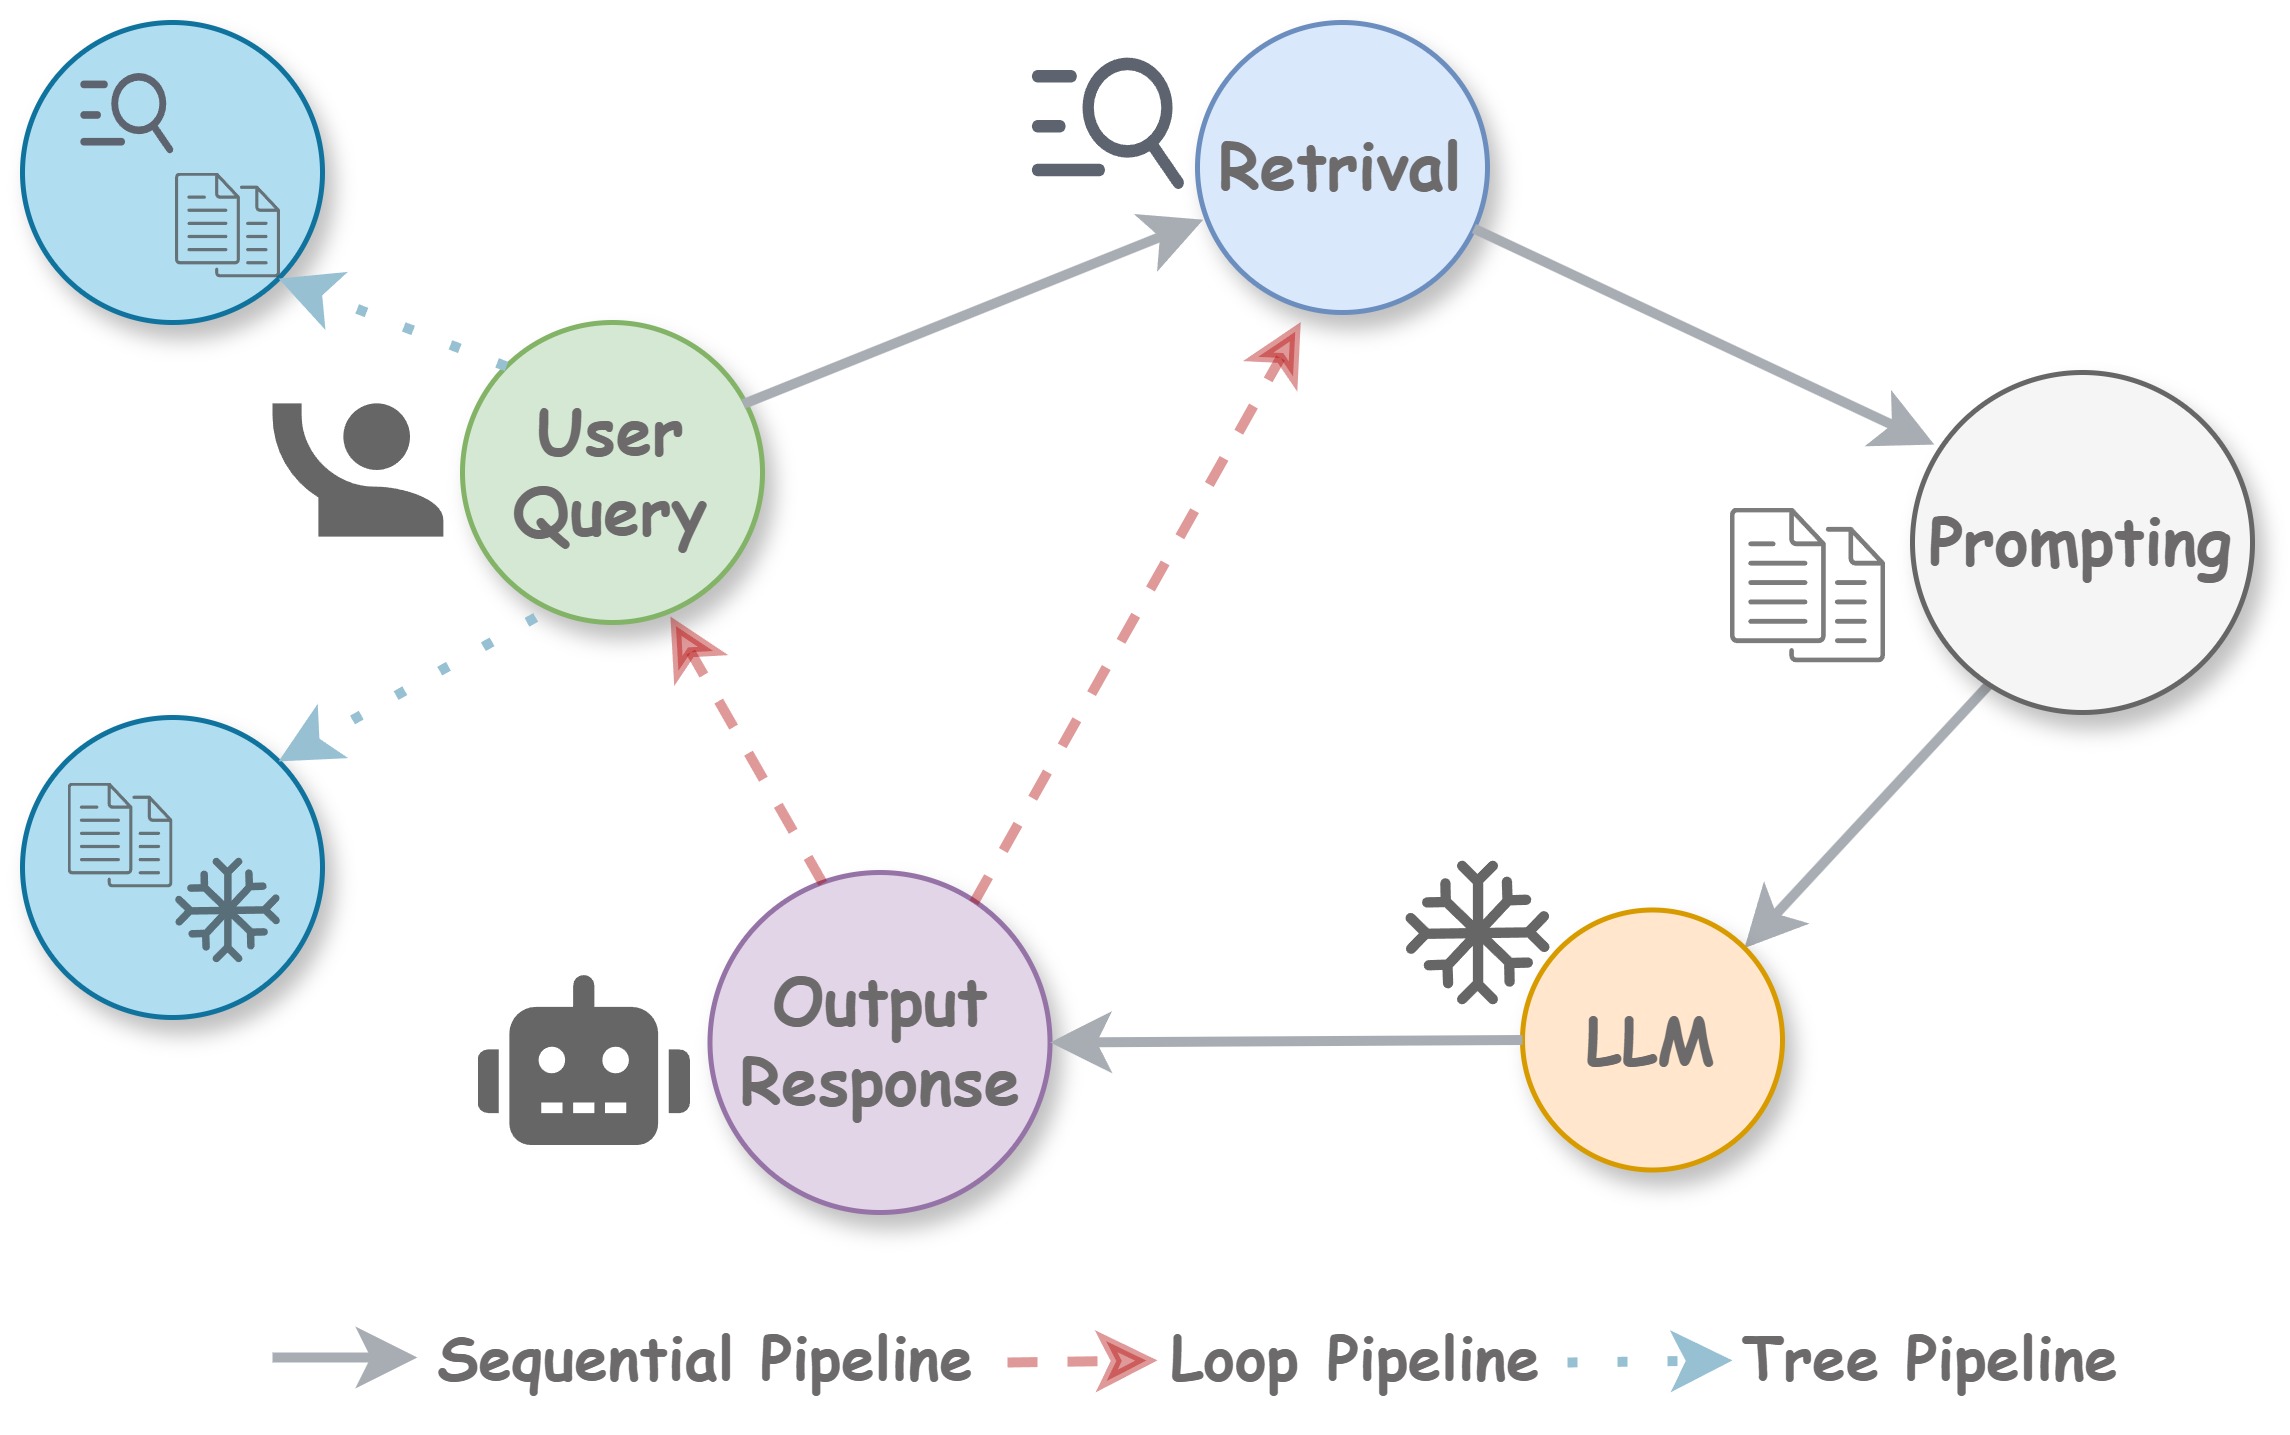
The image is a diagram illustrating a pipeline involving a Large Language Model (LLM). It depicts the flow of information and processes, including user query, retrieval, prompting, and output response. The diagram uses different types of pipelines (sequential, loop, and tree) to show the relationships between the components.
### Components/Axes
* **Nodes:** The diagram contains several nodes represented as circles, each labeled with a specific function or component.
* **User Query:** (Green circle) Represents the initial input from the user.
* **Retrieval:** (Light blue circle) Represents the process of retrieving relevant information. Contains a magnifying glass icon and document icon.
* **Prompting:** (White/Gray circle) Represents the process of creating a prompt for the LLM. Contains a document icon.
* **LLM:** (Light orange circle) Represents the Large Language Model. Contains a snowflake icon.
* **Output Response:** (Purple circle) Represents the final output generated by the system. Contains a robot icon.
* Two additional light blue circles with a magnifying glass icon and document icon, and a snowflake icon and document icon.
* **Pipeline Types (Legend, bottom):**
* **Sequential Pipeline:** Represented by a solid gray arrow.
* **Loop Pipeline:** Represented by a dashed red arrow with an arrowhead.
* **Tree Pipeline:** Represented by a dotted light blue arrow with an arrowhead.
### Detailed Analysis
* **Flow:**
1. The "User Query" node is connected to the "Retrieval" node via a sequential pipeline (solid gray arrow).
2. The "Retrieval" node is connected to the "Prompting" node via a sequential pipeline (solid gray arrow).
3. The "Prompting" node is connected to the "LLM" node via a sequential pipeline (solid gray arrow).
4. The "LLM" node is connected to the "Output Response" node via a sequential pipeline (solid gray arrow).
5. The "Output Response" node is connected back to the "Retrieval" node via a loop pipeline (dashed red arrow).
6. The "User Query" node is connected to two light blue circles via a tree pipeline (dotted light blue arrow).
### Key Observations
* The diagram illustrates a cyclical process where the output response can influence the retrieval stage, creating a feedback loop.
* The use of different pipeline types indicates different relationships and dependencies between the components.
* The "User Query" node branches out to two light blue circles, suggesting parallel or branching processes.
### Interpretation
The diagram represents a sophisticated LLM pipeline that incorporates retrieval, prompting, and a feedback loop. The loop pipeline from "Output Response" to "Retrieval" suggests that the system can refine its information retrieval based on the quality or relevance of the output. The tree pipeline from "User Query" to the light blue circles suggests that the user query triggers multiple parallel processes, potentially for data retrieval or preprocessing. The overall design indicates a system that aims to improve its responses iteratively by learning from its outputs.