## Diagram: Retrieval-Augmented Generation (RAG) Pipeline Flowchart
### Overview
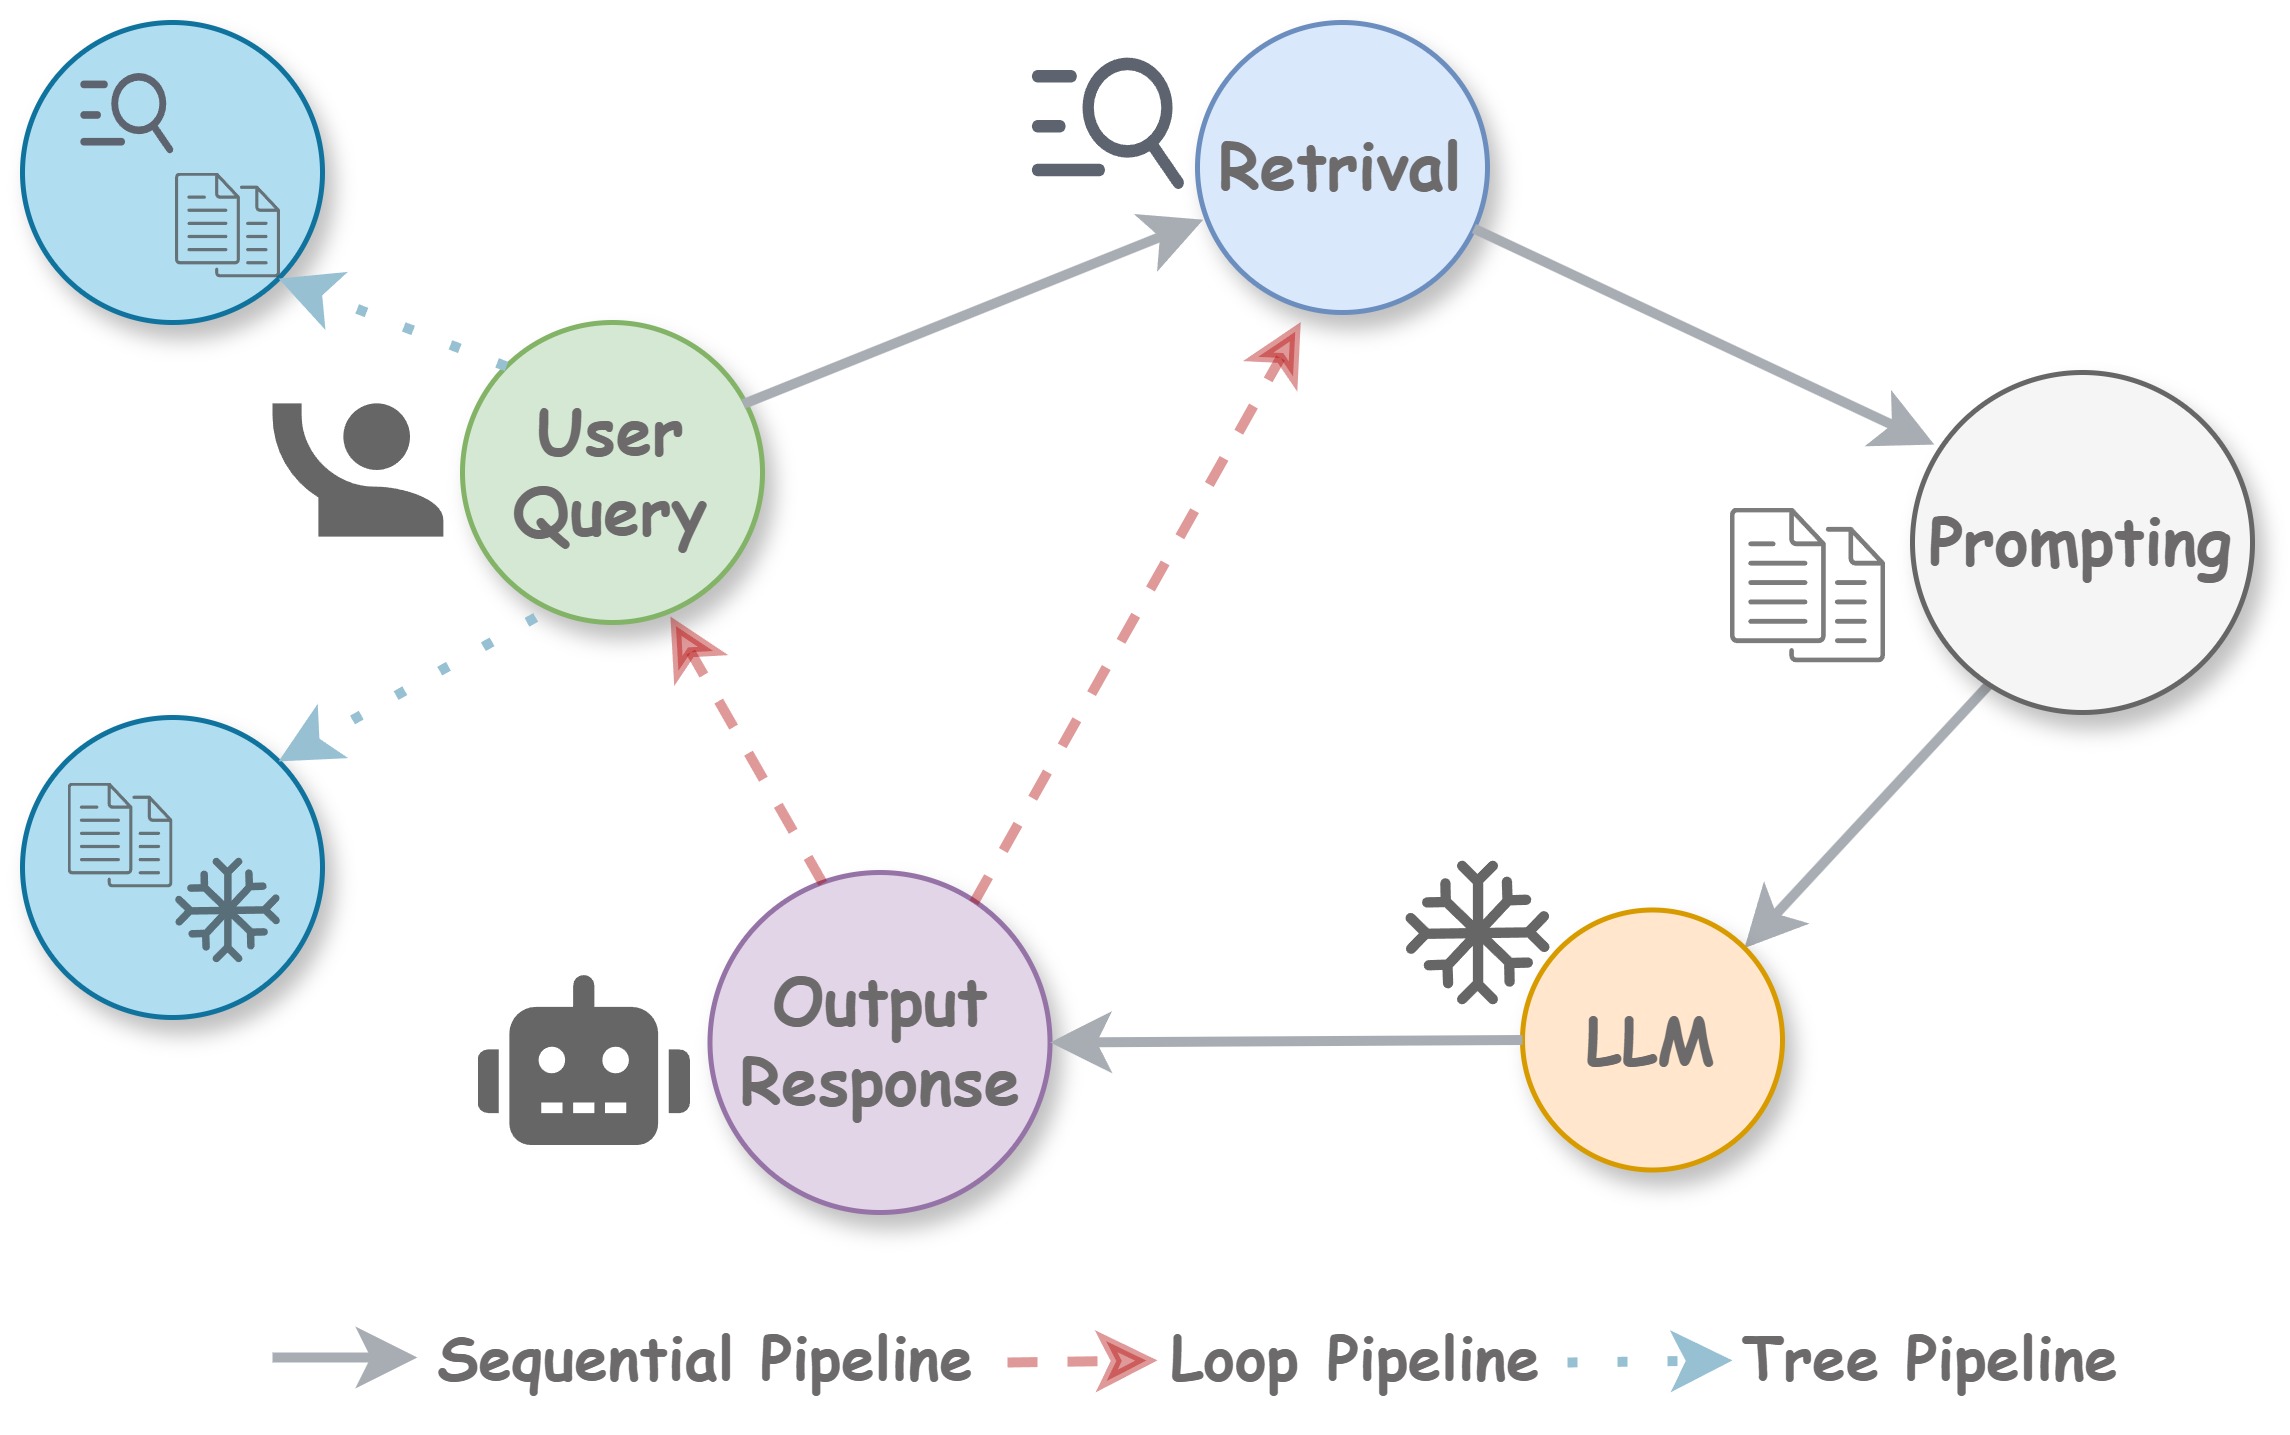
The image is a flowchart diagram illustrating the process flow of a Retrieval-Augmented Generation (RAG) system. It depicts the sequential, looping, and branching pathways a user query follows to generate a response, involving components like retrieval, prompting, and a Large Language Model (LLM). The diagram uses color-coded nodes, directional arrows, and icons to represent different stages and data flows.
### Components/Axes
The diagram consists of several circular nodes connected by three types of arrows, defined in a legend at the bottom center.
**Nodes (Circles):**
1. **User Query** (Light Green Circle, Center-Left): Contains the text "User Query". Accompanied by a dark gray icon of a person raising a hand to its left.
2. **Retrieval** (Light Blue Circle, Top-Center): Contains the text "Retrival" (note: likely a misspelling of "Retrieval"). Accompanied by a dark gray icon of a magnifying glass over a document to its left.
3. **Prompting** (Light Gray Circle, Center-Right): Contains the text "Prompting". Accompanied by a dark gray icon of two documents to its left.
4. **LLM** (Light Orange Circle, Bottom-Right): Contains the text "LLM". Accompanied by a dark gray snowflake icon to its left.
5. **Output Response** (Light Purple Circle, Bottom-Center): Contains the text "Output Response". Accompanied by a dark gray robot head icon to its left.
**Additional Data Source Nodes (Blue Circles):**
* **Top-Left Blue Circle:** Contains a dark gray icon of a magnifying glass over a document. Connected to the "User Query" node via a dotted blue arrow.
* **Bottom-Left Blue Circle:** Contains a dark gray icon of a document and a snowflake. Connected to the "User Query" node via a dotted blue arrow.
**Legend (Bottom Center):**
* **Solid Gray Arrow:** Labeled "Sequential Pipeline".
* **Dashed Red Arrow with Open Arrowhead:** Labeled "Loop Pipeline".
* **Dotted Blue Arrow with Solid Arrowhead:** Labeled "Tree Pipeline".
### Detailed Analysis
**Flow and Connections:**
1. **Primary Sequential Pipeline (Solid Gray Arrows):**
* The process begins at the **User Query** node.
* A solid gray arrow points from **User Query** to **Retrieval**.
* A solid gray arrow points from **Retrieval** to **Prompting**.
* A solid gray arrow points from **Prompting** to **LLM**.
* A solid gray arrow points from **LLM** to **Output Response**.
* This forms the core linear sequence: User Query -> Retrieval -> Prompting -> LLM -> Output Response.
2. **Loop Pipelines (Dashed Red Arrows):**
* A dashed red arrow points from **Output Response** back to **User Query**. This creates a feedback loop where the generated response can inform a new or refined user query.
* A dashed red arrow points from **Output Response** back to **Retrieval**. This creates a loop where the response can trigger a new retrieval step, likely for refinement or gathering more context.
3. **Tree Pipelines (Dotted Blue Arrows):**
* A dotted blue arrow points from the **Top-Left Blue Circle** (magnifying glass/document icon) to the **User Query** node.
* A dotted blue arrow points from the **Bottom-Left Blue Circle** (document/snowflake icon) to the **User Query** node.
* These indicate that the initial "User Query" is informed by or draws from two separate data sources or retrieval branches, represented by the two blue circles. The snowflake icon on the bottom-left source may indicate "frozen" or static data.
### Key Observations
* **Central Hub:** The "User Query" node acts as a central hub, receiving input from external data sources (tree pipelines) and feedback from the system's own output (loop pipelines).
* **Iterative Process:** The presence of two distinct loop pipelines (back to query and back to retrieval) highlights the iterative and potentially conversational nature of advanced RAG systems, where outputs can refine inputs.
* **Data Source Differentiation:** The two blue "tree pipeline" source nodes are visually distinct. The top one has a search icon, suggesting active retrieval, while the bottom one has a snowflake, suggesting a fixed or pre-processed knowledge base.
* **Component Roles:** Icons reinforce the function of each node: a person for the user, a magnifying glass for search/retrieval, documents for prompting/context, a snowflake for the (potentially static) LLM, and a robot for the generated output.
### Interpretation
This diagram visually explains the architecture of a sophisticated RAG system, moving beyond a simple linear pipeline. It demonstrates how such a system integrates multiple knowledge sources (tree pipelines) at the query stage, processes information through a standard sequence (retrieval, prompting, LLM generation), and then uses its own output to create feedback loops. These loops are critical for tasks requiring multi-step reasoning, clarification, or iterative refinement, as the system can re-query its knowledge base or prompt the user again based on its initial response. The separation of "Retrieval" and "LLM" as distinct nodes emphasizes the decoupling of the knowledge access mechanism from the language generation model, which is a core principle of RAG. The diagram effectively communicates that modern AI response generation is not a one-shot process but a dynamic, cyclical flow of information.