TECHNICAL ASSET FINGERPRINT
28a8bae24738e37425988896
Click to view fullscreen
Press ESC or click to close
FOUND IN PAPERS
EXPERT: gemini-2.0-flash VERSION 1
RUNTIME: nugit/gemini/gemini-2.0-flash
INTEL_VERIFIED
## Chart Type: Multiple Line Graphs
### Overview
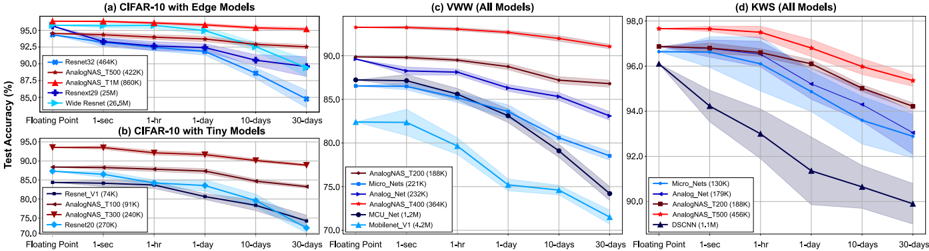
The image contains four line graphs, each displaying the test accuracy (%) of different machine learning models over time. The x-axis represents time intervals: Floating Point, 1-sec, 1-hr, 1-day, 10-days, and 30-days. The y-axis represents test accuracy in percentage. The graphs are titled: (a) CIFAR-10 with Edge Models, (b) CIFAR-10 with Tiny Models, (c) VWW (All Models), and (d) KWS (All Models). Each graph plots multiple models, distinguished by color-coded lines and markers, with corresponding legends indicating the model names and parameter counts (in K or M). Shaded regions around the lines indicate uncertainty or variance.
### Components/Axes
* **X-axis (all graphs):** Time intervals - Floating Point, 1-sec, 1-hr, 1-day, 10-days, 30-days.
* **Y-axis (all graphs):** Test Accuracy (%), ranging from 70.0% to 98.0% with increments of 2.5% or 5.0%.
* **Graph (a) CIFAR-10 with Edge Models:**
* Models: Resnet32 (464K), AnalogNAS\_T500 (422K), AnalogNAS\_T1M (860K), Resnext29 (25M), Wide Resnet (26.5M).
* Y-axis range: 85.0% to 97.5%
* **Graph (b) CIFAR-10 with Tiny Models:**
* Models: Resnet\_V1 (74K), AnalogNAS\_T100 (91K), AnalogNAS\_T300 (240K), Resnet20 (270K).
* Y-axis range: 70.0% to 95.0%
* **Graph (c) VWW (All Models):**
* Models: AnalogNAS\_T200 (188K), Micro\_Nets (221K), Analog\_Net (232K), AnalogNAS\_T400 (364K), MCU\_Net (1.2M), Mobilenet\_V1 (4.2M).
* Y-axis range: 70.0% to 92.5%
* **Graph (d) KWS (All Models):**
* Models: Micro\_Nets (130K), Analog\_Net (179K), AnalogNAS\_T200 (188K), AnalogNAS\_T500 (456K), DSCNN (1.1M).
* Y-axis range: 90.0% to 98.0%
### Detailed Analysis
**Graph (a) CIFAR-10 with Edge Models:**
* **Resnet32 (464K) - Blue line with square markers:** Starts at approximately 96.5% at Floating Point and decreases slightly to around 92.5% at 30-days.
* **AnalogNAS\_T500 (422K) - Red line with circle markers:** Starts at approximately 97.0% at Floating Point and decreases slightly to around 94.5% at 30-days.
* **AnalogNAS\_T1M (860K) - Red line with triangle markers:** Starts at approximately 94.5% at Floating Point and decreases slightly to around 93.5% at 30-days.
* **Resnext29 (25M) - Black line with star markers:** Starts at approximately 93.5% at Floating Point and decreases to around 90.0% at 30-days.
* **Wide Resnet (26.5M) - Cyan line with diamond markers:** Starts at approximately 93.5% at Floating Point and decreases significantly to around 87.5% at 30-days.
**Graph (b) CIFAR-10 with Tiny Models:**
* **Resnet\_V1 (74K) - Dark Blue line with square markers:** Starts at approximately 84.5% at Floating Point and decreases to around 82.0% at 30-days.
* **AnalogNAS\_T100 (91K) - Red line with circle markers:** Starts at approximately 88.5% at Floating Point and decreases to around 86.0% at 30-days.
* **AnalogNAS\_T300 (240K) - Red line with triangle markers:** Starts at approximately 80.0% at Floating Point and decreases to around 77.0% at 30-days.
* **Resnet20 (270K) - Cyan line with diamond markers:** Starts at approximately 88.0% at Floating Point and decreases significantly to around 72.0% at 30-days.
**Graph (c) VWW (All Models):**
* **AnalogNAS\_T200 (188K) - Blue line with square markers:** Starts at approximately 89.5% at Floating Point and decreases to around 84.0% at 30-days.
* **Micro\_Nets (221K) - Dark Blue line with circle markers:** Starts at approximately 87.0% at Floating Point and decreases to around 84.0% at 30-days.
* **Analog\_Net (232K) - Red line with triangle markers:** Starts at approximately 90.0% at Floating Point and decreases slightly to around 88.0% at 30-days.
* **AnalogNAS\_T400 (364K) - Red line with diamond markers:** Starts at approximately 87.5% at Floating Point and decreases to around 84.0% at 30-days.
* **MCU\_Net (1.2M) - Black line with circle markers:** Starts at approximately 87.0% at Floating Point and decreases to around 84.0% at 30-days.
* **Mobilenet\_V1 (4.2M) - Cyan line with triangle markers:** Starts at approximately 82.5% at Floating Point and decreases significantly to around 72.0% at 30-days.
**Graph (d) KWS (All Models):**
* **Micro\_Nets (130K) - Blue line with square markers:** Starts at approximately 96.0% at Floating Point and decreases to around 93.5% at 30-days.
* **Analog\_Net (179K) - Dark Blue line with circle markers:** Starts at approximately 97.0% at Floating Point and decreases to around 95.0% at 30-days.
* **AnalogNAS\_T200 (188K) - Red line with triangle markers:** Starts at approximately 97.5% at Floating Point and decreases slightly to around 96.0% at 30-days.
* **AnalogNAS\_T500 (456K) - Red line with diamond markers:** Starts at approximately 97.0% at Floating Point and decreases slightly to around 95.5% at 30-days.
* **DSCNN (1.1M) - Black line with triangle markers:** Starts at approximately 96.0% at Floating Point and decreases significantly to around 90.5% at 30-days.
### Key Observations
* Most models exhibit a decrease in test accuracy over time, indicating a potential degradation in performance as the time interval increases.
* The "Wide Resnet" model in graph (a) and "Mobilenet\_V1" in graph (c) show the most significant drop in accuracy over time.
* The models in graph (d) "KWS (All Models)" generally maintain higher accuracy levels compared to the other graphs.
* The shaded regions around the lines suggest variability in the model performance, which increases over time for some models.
### Interpretation
The graphs illustrate the performance of various machine learning models across different datasets (CIFAR-10, VWW, KWS) and model sizes (Edge, Tiny, All). The decreasing test accuracy over time suggests that the models may be experiencing some form of "drift" or adaptation to the specific time interval, potentially due to changes in the data distribution or other time-dependent factors. The models with larger parameter counts (e.g., Wide Resnet, Mobilenet\_V1) show a more pronounced decrease in accuracy, which could be attributed to overfitting or sensitivity to changes in the input data. The KWS models generally exhibit higher accuracy, indicating that this dataset may be easier to learn or more stable over time. The uncertainty regions highlight the variability in model performance, which should be considered when evaluating the reliability and robustness of these models.
DECODING INTELLIGENCE...
EXPERT: gemini-3.1-flash-lite-preview-free VERSION 1
RUNTIME: google-free/gemini-3.1-flash-lite-preview
INTEL_VERIFIED
## Multi-Panel Line Chart: Model Accuracy Degradation Over Time
### Overview
This image displays four distinct line charts (labeled a, b, c, and d) comparing the "Test Accuracy (%)" of various machine learning models across different compute/time conditions. The X-axis represents a progression of degradation or time-based drift, ranging from "Floating Point" (baseline) to "1-sec," "1-hr," "1-day," "10-days," and "30-days." The charts illustrate how different model architectures (Edge, Tiny, VWW, KWS) maintain their accuracy when subjected to these conditions.
### Components/Axes
* **Y-Axis:** "Test Accuracy (%)".
* Charts (a) and (b) share a scale from 70.0 to 95.0.
* Chart (c) shares a scale from 70.0 to 90.0.
* Chart (d) uses a scale from 90.0 to 98.0.
* **X-Axis:** Represents time/compute degradation stages: [Floating Point, 1-sec, 1-hr, 1-day, 10-days, 30-days].
* **Legends:** Each chart contains a legend box in the bottom-left or center-left area, detailing the model names and their parameter counts (e.g., 464K).
* **Visual Elements:** Solid lines represent the mean accuracy; shaded regions around the lines represent variance or confidence intervals.
---
### Detailed Analysis
#### (a) CIFAR-10 with Edge Models
* **Legend (Bottom-Left):**
* Resnet32 (464K) - Blue square
* AnalogNAS_T500 (422K) - Dark blue circle
* AnalogNAS_T1M (860K) - Red triangle
* Resnext29 (25M) - Dark blue diamond
* Wide Resnet (26.5M) - Light blue diamond
* **Trends:** The Red line (AnalogNAS_T1M) is the most stable, maintaining ~95% accuracy throughout. The Dark Blue (AnalogNAS_T500) and Blue (Resnet32) lines show moderate degradation. The Dark Blue (Resnext29) and Light Blue (Wide Resnet) lines show the steepest decline, dropping significantly by the 30-day mark.
#### (b) CIFAR-10 with Tiny Models
* **Legend (Bottom-Left):**
* Resnet_V1 (74K) - Dark blue circle
* AnalogNAS_T100 (91K) - Dark blue diamond
* AnalogNAS_T300 (240K) - Red inverted triangle
* Resnet20 (270K) - Light blue diamond
* **Trends:** The Red line (AnalogNAS_T300) remains the most robust, staying near 90-94%. The Dark Blue lines (Resnet_V1 and AnalogNAS_T100) track closely together, showing a steady decline. The Light Blue line (Resnet20) shows the most significant drop, ending near 72%.
#### (c) VWW (All Models)
* **Legend (Bottom-Left):**
* AnalogNAS_T200 (188K) - Dark red diamond
* Micro_Nets (221K) - Light blue circle
* Analog_Net (232K) - Dark blue diamond
* AnalogNAS_T400 (364K) - Red triangle
* MCU_Net (1.2M) - Dark blue circle
* Mobilenet_V1 (4.2M) - Light blue triangle
* **Trends:** The Red line (AnalogNAS_T400) and Dark Red line (AnalogNAS_T200) are the top performers, showing minimal degradation. The Dark Blue lines (MCU_Net, Analog_Net) and Light Blue lines (Micro_Nets, Mobilenet_V1) show steep, parallel declines, with Mobilenet_V1 performing the worst by the 30-day mark.
#### (d) KWS (All Models)
* **Legend (Bottom-Left):**
* Micro_Nets (130K) - Light blue diamond
* Analog_Net (179K) - Dark blue diamond
* AnalogNAS_T200 (188K) - Dark red square
* AnalogNAS_T500 (456K) - Red star
* DSCNN (1.1M) - Dark blue triangle
* **Trends:** The Red (AnalogNAS_T500) and Dark Red (AnalogNAS_T200) lines are highly stable, remaining above 95%. The Dark Blue (DSCNN, Analog_Net) and Light Blue (Micro_Nets) lines show a sharp downward trend, with the Light Blue line dropping to ~92.5% by 30 days.
---
### Key Observations
1. **AnalogNAS Superiority:** Across all four charts, the models prefixed with "AnalogNAS" (indicated by red/dark red lines) consistently demonstrate the highest accuracy and the most resilience to the degradation represented by the X-axis.
2. **Degradation Pattern:** Almost all models exhibit a downward trend as time progresses from "Floating Point" to "30-days." This suggests the X-axis represents hardware aging, drift, or noise accumulation in an analog computing environment.
3. **Parameter Count vs. Robustness:** There is no direct correlation between parameter count and robustness. For example, in chart (c), the 4.2M parameter Mobilenet_V1 performs worse than the 188K parameter AnalogNAS_T200.
4. **Variance:** The shaded regions (uncertainty) are generally wider for the models that experience steeper accuracy drops, indicating that these models are less predictable under degraded conditions.
### Interpretation
The data demonstrates a clear performance gap between standard neural network architectures and those optimized via "AnalogNAS" (likely Neural Architecture Search specifically for analog hardware).
The X-axis progression—from "Floating Point" (the ideal, software-simulated state) to "30-days" (the degraded, physical hardware state)—implies that the "AnalogNAS" models are specifically designed to be robust against the non-idealities (such as thermal noise, voltage drift, or component aging) inherent in analog computing hardware.
Standard models (like Resnet, Mobilenet, DSCNN) suffer significant accuracy loss when moved from a floating-point environment to a degraded analog environment. The "AnalogNAS" models, however, maintain high accuracy, suggesting they have learned weights or architectures that are inherently tolerant to the specific noise profiles of the target hardware. This is a critical finding for the deployment of AI on edge devices, where analog hardware is often preferred for energy efficiency but hindered by reliability issues.
DECODING INTELLIGENCE...
EXPERT: nemotron-free VERSION 1
RUNTIME: free/nvidia/nemotron-nano-12b-v2-vl:free
INTEL_VERIFIED
## Line Graphs: Model Performance Over Time Across Datasets
### Overview
The image contains four line graphs comparing the test accuracy of various machine learning models over time intervals (1-second to 30-days) on different datasets: CIFAR-10 (Edge Models), CIFAR-10 (Tiny Models), VW (All Models), and KWS (All Models). Each graph includes multiple data series (models) with shaded confidence intervals.
---
### Components/Axes
1. **Subplot (a): CIFAR-10 with Edge Models**
- **X-axis**: Time intervals (Floating Point, 1-sec, 1-hr, 1-day, 10-days, 30-days)
- **Y-axis**: Test Accuracy (%)
- **Legend**:
- Resnet32 (464K) - Blue
- AnalogNAS_T500 (422K) - Red
- AnalogNAS_T1M (860K) - Maroon
- Resnext29 (25M) - Teal
- Wide Resnet (26.5M) - Dark Blue
- **Shaded Areas**: Confidence intervals (light blue for Resnet32, light red for AnalogNAS_T500, etc.)
2. **Subplot (b): CIFAR-10 with Tiny Models**
- **X-axis**: Time intervals (Floating Point, 1-sec, 1-hr, 1-day, 10-days, 30-days)
- **Y-axis**: Test Accuracy (%)
- **Legend**:
- Resnet_V1 (74K) - Dark Blue
- AnalogNAS_T100 (91K) - Brown
- AnalogNAS_T300 (240K) - Red
- Resnet20 (270K) - Teal
- **Shaded Areas**: Confidence intervals (dark blue for Resnet_V1, dark red for AnalogNAS_T300, etc.)
3. **Subplot (c): VW (All Models)**
- **X-axis**: Time intervals (Floating Point, 1-sec, 1-hr, 1-day, 10-days, 30-days)
- **Y-axis**: Test Accuracy (%)
- **Legend**:
- Micro_Nets (130K) - Light Blue
- Analog_Net (221K) - Purple
- AnalogNAS_T200 (188K) - Maroon
- AnalogNAS_T400 (364K) - Red
- MCU_Net (1.2M) - Dark Blue
- Mobilenet_V1 (4.2M) - Teal
- **Shaded Areas**: Confidence intervals (light purple for Analog_Net, light red for AnalogNAS_T400, etc.)
4. **Subplot (d): KWS (All Models)**
- **X-axis**: Time intervals (Floating Point, 1-sec, 1-hr, 1-day, 10-days, 30-days)
- **Y-axis**: Test Accuracy (%)
- **Legend**:
- Micro_Nets (130K) - Light Blue
- Analog_Net (179K) - Purple
- AnalogNAS_T200 (188K) - Maroon
- AnalogNAS_T500 (456K) - Red
- DSCNN (1.1M) - Dark Blue
- **Shaded Areas**: Confidence intervals (light purple for Analog_Net, light red for AnalogNAS_T500, etc.)
---
### Detailed Analysis
#### Subplot (a): CIFAR-10 with Edge Models
- **Trends**:
- Resnet32 (Blue) starts at ~95% accuracy but declines sharply to ~85% over 30 days.
- AnalogNAS_T500 (Red) maintains ~92-93% accuracy consistently.
- AnalogNAS_T1M (Maroon) shows a gradual decline from ~94% to ~90%.
- Resnext29 (Teal) and Wide Resnet (Dark Blue) decline from ~94% to ~88% and ~86%, respectively.
- **Confidence Intervals**: All models show widening intervals over time, indicating increased uncertainty.
#### Subplot (b): CIFAR-10 with Tiny Models
- **Trends**:
- Resnet_V1 (Dark Blue) drops from ~85% to ~75% over 30 days.
- AnalogNAS_T100 (Brown) declines from ~88% to ~84%.
- AnalogNAS_T300 (Red) remains stable at ~88-89%.
- Resnet20 (Teal) declines from ~85% to ~78%.
- **Confidence Intervals**: Narrower than subplot (a), but still widen over time.
#### Subplot (c): VW (All Models)
- **Trends**:
- Micro_Nets (Light Blue) declines from ~90% to ~85%.
- Analog_Net (Purple) drops from ~90% to ~85%.
- AnalogNAS_T200 (Maroon) maintains ~90-91% accuracy.
- AnalogNAS_T400 (Red) declines from ~92% to ~88%.
- MCU_Net (Dark Blue) and Mobilenet_V1 (Teal) show steep declines to ~80% and ~78%, respectively.
- **Confidence Intervals**: Moderate widening, with AnalogNAS_T200 showing the least variability.
#### Subplot (d): KWS (All Models)
- **Trends**:
- Micro_Nets (Light Blue) declines from ~96% to ~92%.
- Analog_Net (Purple) drops from ~96% to ~94%.
- AnalogNAS_T200 (Maroon) remains stable at ~96-97%.
- AnalogNAS_T500 (Red) declines from ~97% to ~95%.
- DSCNN (Dark Blue) shows a steep decline from ~96% to ~90%.
- **Confidence Intervals**: Widest among all subplots, especially for DSCNN.
---
### Key Observations
1. **Model Robustness**: AnalogNAS variants (e.g., AnalogNAS_T200, AnalogNAS_T500) consistently outperform other models in maintaining accuracy over time.
2. **Degradation Over Time**: All models exhibit accuracy degradation, with steeper declines in larger models (e.g., Wide Resnet, Mobilenet_V1).
3. **Confidence Intervals**: Wider intervals over time suggest reduced reliability in long-term predictions.
4. **Dataset-Specific Performance**:
- Edge Models (subplots a/b) show higher initial accuracy but faster degradation.
- VW and KWS datasets (subplots c/d) have higher baseline accuracy but similar degradation patterns.
---
### Interpretation
The data highlights the trade-off between model complexity and long-term reliability. AnalogNAS models demonstrate superior robustness, likely due to their architecture or training strategies that mitigate performance decay. The widening confidence intervals over time underscore the challenges of deploying models in dynamic environments where data distributions may shift. For real-world applications, prioritizing models with stable accuracy (e.g., AnalogNAS_T200) and smaller confidence intervals is critical to ensure sustained performance.
DECODING INTELLIGENCE...