TECHNICAL ASSET FINGERPRINT
28a8bae24738e37425988896
Click to view fullscreen
Press ESC or click to close
FOUND IN PAPERS
EXPERT: gemini-2.0-flash VERSION 1
RUNTIME: nugit/gemini/gemini-2.0-flash
INTEL_VERIFIED
## Chart Type: Multiple Line Graphs
### Overview
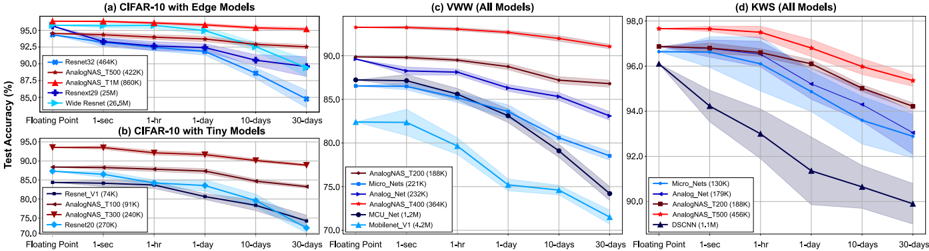
The image contains four line graphs, each displaying the test accuracy (%) of different machine learning models over time. The x-axis represents time intervals: Floating Point, 1-sec, 1-hr, 1-day, 10-days, and 30-days. The y-axis represents test accuracy in percentage. The graphs are titled: (a) CIFAR-10 with Edge Models, (b) CIFAR-10 with Tiny Models, (c) VWW (All Models), and (d) KWS (All Models). Each graph plots multiple models, distinguished by color-coded lines and markers, with corresponding legends indicating the model names and parameter counts (in K or M). Shaded regions around the lines indicate uncertainty or variance.
### Components/Axes
* **X-axis (all graphs):** Time intervals - Floating Point, 1-sec, 1-hr, 1-day, 10-days, 30-days.
* **Y-axis (all graphs):** Test Accuracy (%), ranging from 70.0% to 98.0% with increments of 2.5% or 5.0%.
* **Graph (a) CIFAR-10 with Edge Models:**
* Models: Resnet32 (464K), AnalogNAS\_T500 (422K), AnalogNAS\_T1M (860K), Resnext29 (25M), Wide Resnet (26.5M).
* Y-axis range: 85.0% to 97.5%
* **Graph (b) CIFAR-10 with Tiny Models:**
* Models: Resnet\_V1 (74K), AnalogNAS\_T100 (91K), AnalogNAS\_T300 (240K), Resnet20 (270K).
* Y-axis range: 70.0% to 95.0%
* **Graph (c) VWW (All Models):**
* Models: AnalogNAS\_T200 (188K), Micro\_Nets (221K), Analog\_Net (232K), AnalogNAS\_T400 (364K), MCU\_Net (1.2M), Mobilenet\_V1 (4.2M).
* Y-axis range: 70.0% to 92.5%
* **Graph (d) KWS (All Models):**
* Models: Micro\_Nets (130K), Analog\_Net (179K), AnalogNAS\_T200 (188K), AnalogNAS\_T500 (456K), DSCNN (1.1M).
* Y-axis range: 90.0% to 98.0%
### Detailed Analysis
**Graph (a) CIFAR-10 with Edge Models:**
* **Resnet32 (464K) - Blue line with square markers:** Starts at approximately 96.5% at Floating Point and decreases slightly to around 92.5% at 30-days.
* **AnalogNAS\_T500 (422K) - Red line with circle markers:** Starts at approximately 97.0% at Floating Point and decreases slightly to around 94.5% at 30-days.
* **AnalogNAS\_T1M (860K) - Red line with triangle markers:** Starts at approximately 94.5% at Floating Point and decreases slightly to around 93.5% at 30-days.
* **Resnext29 (25M) - Black line with star markers:** Starts at approximately 93.5% at Floating Point and decreases to around 90.0% at 30-days.
* **Wide Resnet (26.5M) - Cyan line with diamond markers:** Starts at approximately 93.5% at Floating Point and decreases significantly to around 87.5% at 30-days.
**Graph (b) CIFAR-10 with Tiny Models:**
* **Resnet\_V1 (74K) - Dark Blue line with square markers:** Starts at approximately 84.5% at Floating Point and decreases to around 82.0% at 30-days.
* **AnalogNAS\_T100 (91K) - Red line with circle markers:** Starts at approximately 88.5% at Floating Point and decreases to around 86.0% at 30-days.
* **AnalogNAS\_T300 (240K) - Red line with triangle markers:** Starts at approximately 80.0% at Floating Point and decreases to around 77.0% at 30-days.
* **Resnet20 (270K) - Cyan line with diamond markers:** Starts at approximately 88.0% at Floating Point and decreases significantly to around 72.0% at 30-days.
**Graph (c) VWW (All Models):**
* **AnalogNAS\_T200 (188K) - Blue line with square markers:** Starts at approximately 89.5% at Floating Point and decreases to around 84.0% at 30-days.
* **Micro\_Nets (221K) - Dark Blue line with circle markers:** Starts at approximately 87.0% at Floating Point and decreases to around 84.0% at 30-days.
* **Analog\_Net (232K) - Red line with triangle markers:** Starts at approximately 90.0% at Floating Point and decreases slightly to around 88.0% at 30-days.
* **AnalogNAS\_T400 (364K) - Red line with diamond markers:** Starts at approximately 87.5% at Floating Point and decreases to around 84.0% at 30-days.
* **MCU\_Net (1.2M) - Black line with circle markers:** Starts at approximately 87.0% at Floating Point and decreases to around 84.0% at 30-days.
* **Mobilenet\_V1 (4.2M) - Cyan line with triangle markers:** Starts at approximately 82.5% at Floating Point and decreases significantly to around 72.0% at 30-days.
**Graph (d) KWS (All Models):**
* **Micro\_Nets (130K) - Blue line with square markers:** Starts at approximately 96.0% at Floating Point and decreases to around 93.5% at 30-days.
* **Analog\_Net (179K) - Dark Blue line with circle markers:** Starts at approximately 97.0% at Floating Point and decreases to around 95.0% at 30-days.
* **AnalogNAS\_T200 (188K) - Red line with triangle markers:** Starts at approximately 97.5% at Floating Point and decreases slightly to around 96.0% at 30-days.
* **AnalogNAS\_T500 (456K) - Red line with diamond markers:** Starts at approximately 97.0% at Floating Point and decreases slightly to around 95.5% at 30-days.
* **DSCNN (1.1M) - Black line with triangle markers:** Starts at approximately 96.0% at Floating Point and decreases significantly to around 90.5% at 30-days.
### Key Observations
* Most models exhibit a decrease in test accuracy over time, indicating a potential degradation in performance as the time interval increases.
* The "Wide Resnet" model in graph (a) and "Mobilenet\_V1" in graph (c) show the most significant drop in accuracy over time.
* The models in graph (d) "KWS (All Models)" generally maintain higher accuracy levels compared to the other graphs.
* The shaded regions around the lines suggest variability in the model performance, which increases over time for some models.
### Interpretation
The graphs illustrate the performance of various machine learning models across different datasets (CIFAR-10, VWW, KWS) and model sizes (Edge, Tiny, All). The decreasing test accuracy over time suggests that the models may be experiencing some form of "drift" or adaptation to the specific time interval, potentially due to changes in the data distribution or other time-dependent factors. The models with larger parameter counts (e.g., Wide Resnet, Mobilenet\_V1) show a more pronounced decrease in accuracy, which could be attributed to overfitting or sensitivity to changes in the input data. The KWS models generally exhibit higher accuracy, indicating that this dataset may be easier to learn or more stable over time. The uncertainty regions highlight the variability in model performance, which should be considered when evaluating the reliability and robustness of these models.
DECODING INTELLIGENCE...