TECHNICAL ASSET FINGERPRINT
28a8bae24738e37425988896
Click to view fullscreen
Press ESC or click to close
FOUND IN PAPERS
EXPERT: healer-alpha-free VERSION 1
RUNTIME: free/openrouter/healer-alpha
INTEL_VERIFIED
## Multi-Panel Line Charts: Model Accuracy Over Time
### Overview
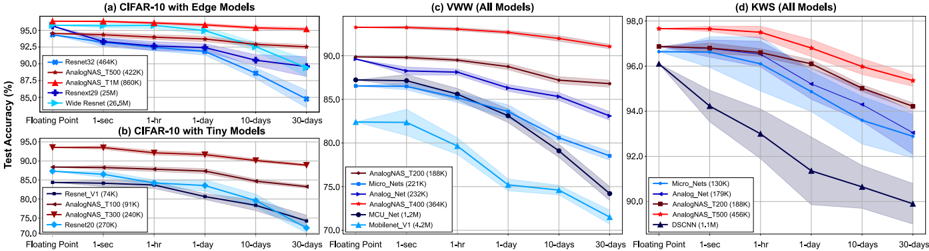
The image contains four line charts arranged in a 2x2 grid, labeled (a), (b), (c), and (d). Each chart plots "Test Accuracy (%)" on the Y-axis against a time-based X-axis with discrete intervals: "Floating Point", "1-sec", "1-hr", "1-day", "10-days", and "30-days". The charts compare the performance degradation of various neural network models over time, likely simulating hardware non-idealities or noise. Shaded regions around each line indicate confidence intervals or variance.
### Components/Axes
* **Common X-Axis (All Plots):** Labeled with time intervals: `Floating Point`, `1-sec`, `1-hr`, `1-day`, `10-days`, `30-days`.
* **Common Y-Axis (All Plots):** Labeled `Test Accuracy (%)`. The scale varies per plot.
* **Subplot Titles:**
* (a) `CIFAR-10 with Edge Models`
* (b) `CIFAR-10 with Tiny Models`
* (c) `VWW (All Models)`
* (d) `KWS (All Models)`
* **Legends:** Each subplot contains a legend box identifying the plotted lines by model name and parameter count (in parentheses). The legend is positioned within the plot area, typically in the lower-left or center-left region.
### Detailed Analysis
**Subplot (a): CIFAR-10 with Edge Models**
* **Y-Axis Range:** ~80% to 95%.
* **Models & Trends (from top to bottom at "Floating Point"):**
1. **AnalogNAS_T500 (422K)** - Red line. Starts highest at ~94.5%. Shows a very gradual, slight downward slope, ending at ~93.5% at 30-days. Most robust.
2. **AnalogNAS_T1M (860K)** - Dark red/brown line. Starts at ~93%. Follows a similar gentle downward trend as T500, ending near ~92%.
3. **ResNet20 (269K)** - Light blue line. Starts at ~92.5%. Declines more steeply than the AnalogNAS models, ending at ~87%.
4. **ResNet32 (464K)** - Dark blue line. Starts at ~92%. Declines similarly to ResNet20, ending at ~86%.
5. **Wide ResNet (36.5M)** - Cyan line. Starts at ~91.5%. Shows the steepest decline among this group, dropping to ~84% at 30-days.
**Subplot (b): CIFAR-10 with Tiny Models**
* **Y-Axis Range:** ~70% to 95%.
* **Models & Trends (from top to bottom at "Floating Point"):**
1. **AnalogNAS_T500 (249K)** - Dark red/brown line. Starts highest at ~94%. Very gradual decline to ~92%.
2. **AnalogNAS_T300 (149K)** - Red line. Starts at ~91%. Declines gently to ~89%.
3. **ResNet_V1 (74K)** - Dark blue line. Starts at ~88%. Declines to ~83%.
4. **Micro_Nets (221K)** - Light blue line. Starts at ~87%. Declines to ~82%.
5. **ResNet20 (278K)** - Cyan line. Starts at ~86%. Declines to ~80%.
6. **MobileNet_V1 (4.2M)** - Very light blue/cyan line. Starts lowest at ~82%. Declines most steeply, dropping to ~72% at 30-days.
**Subplot (c): VWW (All Models)**
* **Y-Axis Range:** ~70% to 92%.
* **Models & Trends (from top to bottom at "Floating Point"):**
1. **AnalogNAS_T500 (189K)** - Red line. Starts highest at ~92%. Shows a steady, moderate decline to ~89%.
2. **Analog_Net (232K)** - Dark red/brown line. Starts at ~89%. Declines to ~86%.
3. **Micro_Nets (221K)** - Dark blue line. Starts at ~87%. Declines to ~84%.
4. **ResNet_V1 (664K)** - Light blue line. Starts at ~86%. Declines to ~83%.
5. **AnalogNAS_T300 (1M)** - Blue line. Starts at ~82%. Declines to ~79%.
6. **MobileNet_V1 (4.2M)** - Cyan line. Starts at ~82%. Declines most steeply, dropping to ~72%.
**Subplot (d): KWS (All Models)**
* **Y-Axis Range:** ~88% to 98%.
* **Models & Trends (from top to bottom at "Floating Point"):**
1. **AnalogNAS_T500 (456K)** - Red line. Starts highest at ~97.5%. Shows a very slight decline, remaining above ~96% at 30-days.
2. **AnalogNAS_T1M (888K)** - Dark red/brown line. Starts at ~97%. Declines gently to ~95%.
3. **Micro_Nets (130K)** - Light blue line. Starts at ~96.5%. Declines to ~94%.
4. **Analog_Net (179K)** - Dark blue line. Starts at ~96%. Declines to ~93%.
5. **ResNet_V1 (664K)** - Blue line. Starts at ~96%. Declines to ~92%.
6. **DS-CNN (1.1M)** - Very dark blue/black line. Starts at ~96%. Shows the most dramatic decline, dropping sharply to ~89% at 30-days. Its shaded confidence interval is notably wide.
### Key Observations
1. **Universal Degradation:** All models across all tasks show a decrease in test accuracy as the time interval increases from "Floating Point" to "30-days".
2. **AnalogNAS Superiority:** Models with the "AnalogNAS" prefix (red/dark red lines) consistently occupy the top positions in each chart and exhibit the most gradual slopes, indicating superior robustness over time.
3. **Model Size vs. Robustness:** Larger models do not necessarily degrade less. For example, in (b), the large MobileNet_V1 (4.2M) degrades the most, while in (a), the large Wide ResNet (36.5M) also degrades significantly. The AnalogNAS models, which are not the largest, perform best.
4. **Task Sensitivity:** The rate and extent of degradation vary by task. The KWS task (d) shows the highest overall accuracies and the smallest relative drops for top models, while the VWW task (c) and CIFAR-10 Tiny Models (b) show larger drops, especially for non-optimized models.
5. **Confidence Intervals:** The shaded regions indicate variance. The DS-CNN model in (d) has a very wide shaded area, suggesting high sensitivity or instability in its performance over time.
### Interpretation
This data demonstrates the critical impact of time-dependent hardware non-idealities (e.g., analog noise, device drift) on the inference accuracy of neural networks deployed on edge hardware. The "Floating Point" baseline represents ideal software performance.
The key finding is that **model architecture and training methodology (like AnalogNAS) are more significant factors for long-term robustness than raw model size.** AnalogNAS models are explicitly designed for analog hardware, making them inherently more resilient to the noise and drift that accumulate over operational time (seconds to months). The charts provide empirical evidence that such hardware-aware neural architecture search yields models that maintain their accuracy far better than conventional architectures (ResNet, MobileNet, DS-CNN) when subjected to simulated long-term hardware effects.
The practical implication is that for reliable edge AI deployment, especially in analog or low-precision hardware, selecting or designing models for temporal robustness is as important as optimizing for initial accuracy and parameter count. The degradation curves allow engineers to predict accuracy loss over a product's operational lifetime.
DECODING INTELLIGENCE...