## Line Graphs: Model Performance Over Time Across Datasets
### Overview
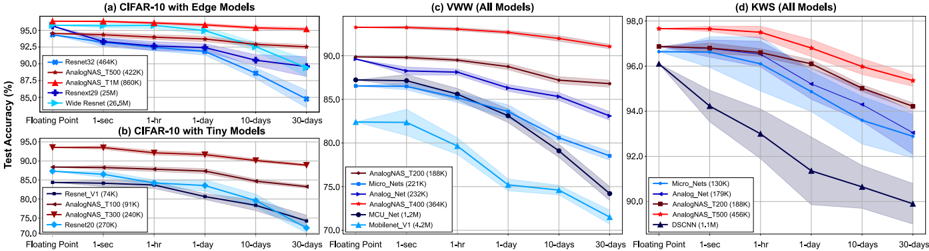
The image contains four line graphs comparing the test accuracy of various machine learning models over time intervals (1-second to 30-days) on different datasets: CIFAR-10 (Edge Models), CIFAR-10 (Tiny Models), VW (All Models), and KWS (All Models). Each graph includes multiple data series (models) with shaded confidence intervals.
---
### Components/Axes
1. **Subplot (a): CIFAR-10 with Edge Models**
- **X-axis**: Time intervals (Floating Point, 1-sec, 1-hr, 1-day, 10-days, 30-days)
- **Y-axis**: Test Accuracy (%)
- **Legend**:
- Resnet32 (464K) - Blue
- AnalogNAS_T500 (422K) - Red
- AnalogNAS_T1M (860K) - Maroon
- Resnext29 (25M) - Teal
- Wide Resnet (26.5M) - Dark Blue
- **Shaded Areas**: Confidence intervals (light blue for Resnet32, light red for AnalogNAS_T500, etc.)
2. **Subplot (b): CIFAR-10 with Tiny Models**
- **X-axis**: Time intervals (Floating Point, 1-sec, 1-hr, 1-day, 10-days, 30-days)
- **Y-axis**: Test Accuracy (%)
- **Legend**:
- Resnet_V1 (74K) - Dark Blue
- AnalogNAS_T100 (91K) - Brown
- AnalogNAS_T300 (240K) - Red
- Resnet20 (270K) - Teal
- **Shaded Areas**: Confidence intervals (dark blue for Resnet_V1, dark red for AnalogNAS_T300, etc.)
3. **Subplot (c): VW (All Models)**
- **X-axis**: Time intervals (Floating Point, 1-sec, 1-hr, 1-day, 10-days, 30-days)
- **Y-axis**: Test Accuracy (%)
- **Legend**:
- Micro_Nets (130K) - Light Blue
- Analog_Net (221K) - Purple
- AnalogNAS_T200 (188K) - Maroon
- AnalogNAS_T400 (364K) - Red
- MCU_Net (1.2M) - Dark Blue
- Mobilenet_V1 (4.2M) - Teal
- **Shaded Areas**: Confidence intervals (light purple for Analog_Net, light red for AnalogNAS_T400, etc.)
4. **Subplot (d): KWS (All Models)**
- **X-axis**: Time intervals (Floating Point, 1-sec, 1-hr, 1-day, 10-days, 30-days)
- **Y-axis**: Test Accuracy (%)
- **Legend**:
- Micro_Nets (130K) - Light Blue
- Analog_Net (179K) - Purple
- AnalogNAS_T200 (188K) - Maroon
- AnalogNAS_T500 (456K) - Red
- DSCNN (1.1M) - Dark Blue
- **Shaded Areas**: Confidence intervals (light purple for Analog_Net, light red for AnalogNAS_T500, etc.)
---
### Detailed Analysis
#### Subplot (a): CIFAR-10 with Edge Models
- **Trends**:
- Resnet32 (Blue) starts at ~95% accuracy but declines sharply to ~85% over 30 days.
- AnalogNAS_T500 (Red) maintains ~92-93% accuracy consistently.
- AnalogNAS_T1M (Maroon) shows a gradual decline from ~94% to ~90%.
- Resnext29 (Teal) and Wide Resnet (Dark Blue) decline from ~94% to ~88% and ~86%, respectively.
- **Confidence Intervals**: All models show widening intervals over time, indicating increased uncertainty.
#### Subplot (b): CIFAR-10 with Tiny Models
- **Trends**:
- Resnet_V1 (Dark Blue) drops from ~85% to ~75% over 30 days.
- AnalogNAS_T100 (Brown) declines from ~88% to ~84%.
- AnalogNAS_T300 (Red) remains stable at ~88-89%.
- Resnet20 (Teal) declines from ~85% to ~78%.
- **Confidence Intervals**: Narrower than subplot (a), but still widen over time.
#### Subplot (c): VW (All Models)
- **Trends**:
- Micro_Nets (Light Blue) declines from ~90% to ~85%.
- Analog_Net (Purple) drops from ~90% to ~85%.
- AnalogNAS_T200 (Maroon) maintains ~90-91% accuracy.
- AnalogNAS_T400 (Red) declines from ~92% to ~88%.
- MCU_Net (Dark Blue) and Mobilenet_V1 (Teal) show steep declines to ~80% and ~78%, respectively.
- **Confidence Intervals**: Moderate widening, with AnalogNAS_T200 showing the least variability.
#### Subplot (d): KWS (All Models)
- **Trends**:
- Micro_Nets (Light Blue) declines from ~96% to ~92%.
- Analog_Net (Purple) drops from ~96% to ~94%.
- AnalogNAS_T200 (Maroon) remains stable at ~96-97%.
- AnalogNAS_T500 (Red) declines from ~97% to ~95%.
- DSCNN (Dark Blue) shows a steep decline from ~96% to ~90%.
- **Confidence Intervals**: Widest among all subplots, especially for DSCNN.
---
### Key Observations
1. **Model Robustness**: AnalogNAS variants (e.g., AnalogNAS_T200, AnalogNAS_T500) consistently outperform other models in maintaining accuracy over time.
2. **Degradation Over Time**: All models exhibit accuracy degradation, with steeper declines in larger models (e.g., Wide Resnet, Mobilenet_V1).
3. **Confidence Intervals**: Wider intervals over time suggest reduced reliability in long-term predictions.
4. **Dataset-Specific Performance**:
- Edge Models (subplots a/b) show higher initial accuracy but faster degradation.
- VW and KWS datasets (subplots c/d) have higher baseline accuracy but similar degradation patterns.
---
### Interpretation
The data highlights the trade-off between model complexity and long-term reliability. AnalogNAS models demonstrate superior robustness, likely due to their architecture or training strategies that mitigate performance decay. The widening confidence intervals over time underscore the challenges of deploying models in dynamic environments where data distributions may shift. For real-world applications, prioritizing models with stable accuracy (e.g., AnalogNAS_T200) and smaller confidence intervals is critical to ensure sustained performance.