## [Diagram/Text Analysis]: Mathematical Problem Solving and Error Correction
### Overview
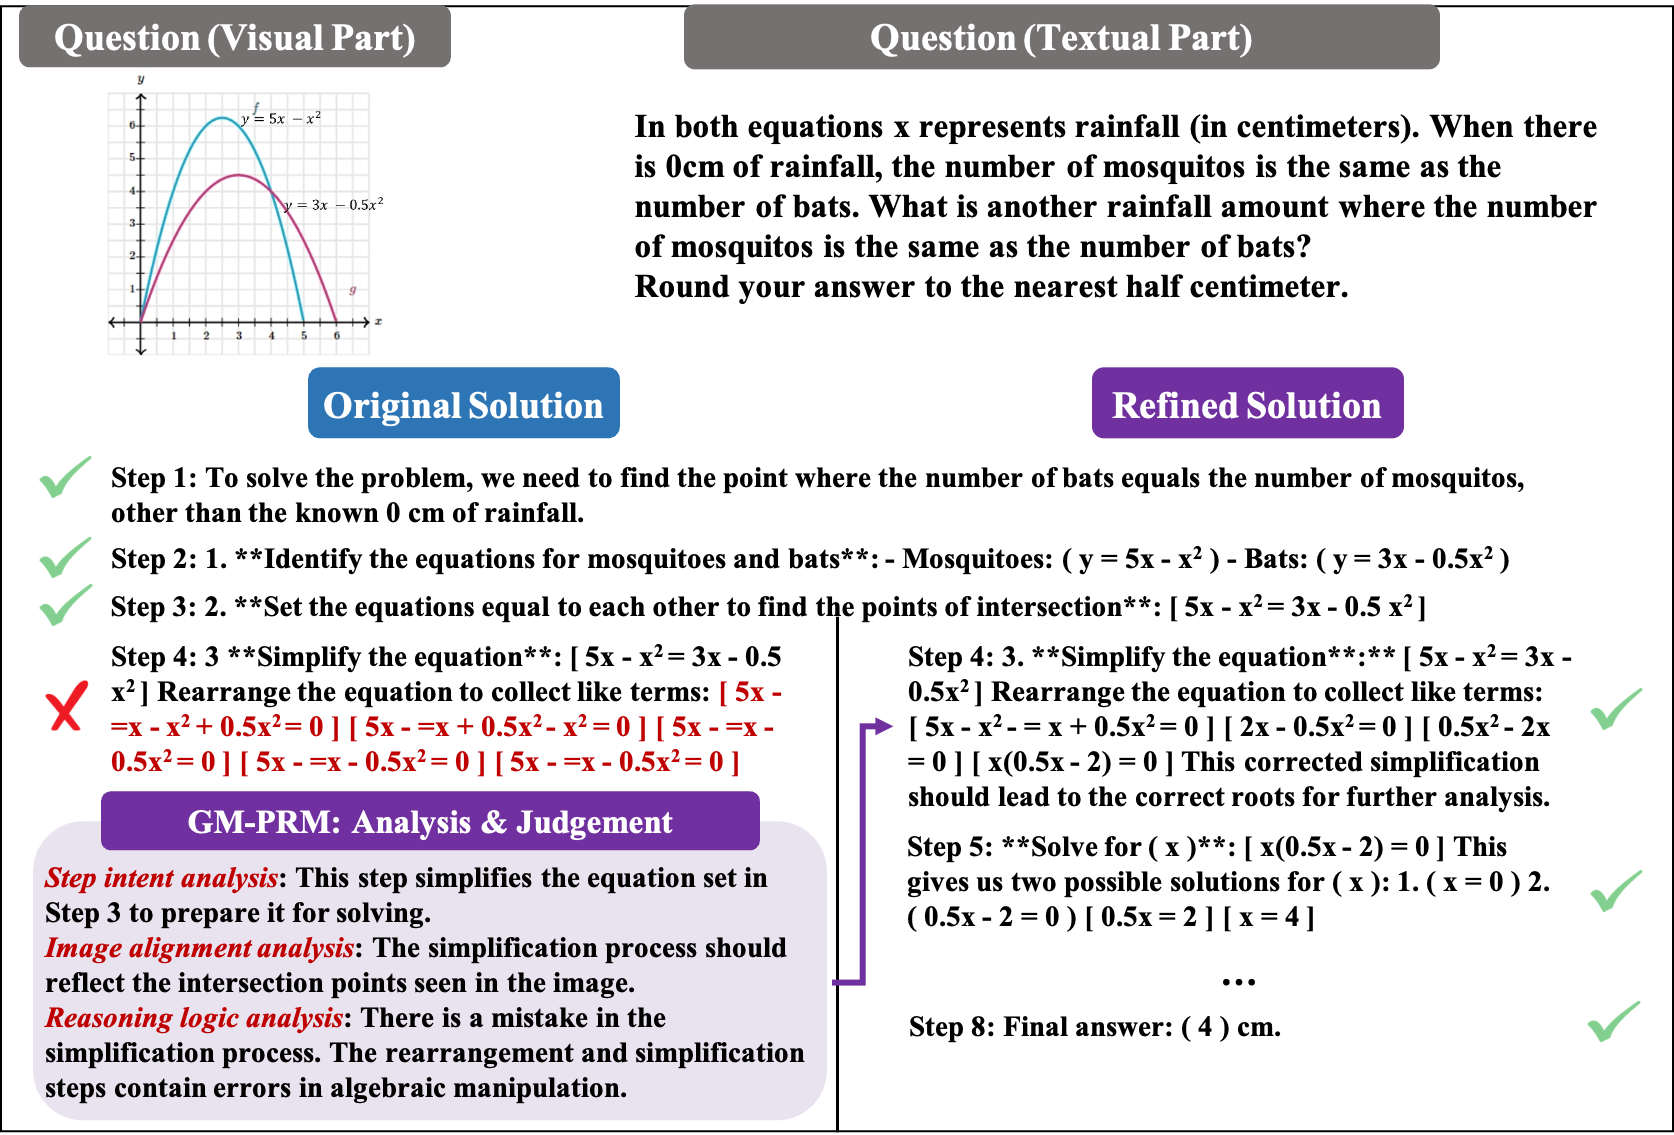
The image is a composite educational graphic designed to teach algebraic problem-solving. It presents a word problem involving two quadratic equations, a graphical representation of these equations, an incorrect attempt at solving the problem ("Original Solution"), a corrected version ("Refined Solution"), and a meta-analysis box ("GM-PRM: Analysis & Judgement") that critiques the logic of the original attempt.
### Components/Axes
**1. Graph (Top Left)**
* **Axes:** A Cartesian coordinate system.
* **X-axis:** Labeled "x", representing rainfall in centimeters. Scale ranges from 0 to 6.
* **Y-axis:** Labeled "y", representing population count. Scale ranges from 0 to 6.
* **Curves:**
* **Blue Curve:** Labeled "$y = 5x - x^2$". This parabola opens downward, starting at $(0,0)$, peaking at approximately $(2.5, 6.25)$, and intersecting the x-axis at $x=5$.
* **Magenta Curve:** Labeled "$y = 3x - 0.5x^2$". This parabola opens downward, starting at $(0,0)$, peaking at approximately $(3, 4.5)$, and intersecting the x-axis at $x=6$.
* **Intersection Points:** The curves intersect at $(0,0)$ and $(4,4)$.
**2. Textual Question (Top Right)**
* **Content:** "In both equations x represents rainfall (in centimeters). When there is 0cm of rainfall, the number of mosquitos is the same as the number of bats. What is another rainfall amount where the number of mosquitos is the same as the number of bats? Round your answer to the nearest half centimeter."
**3. Original Solution (Middle Left)**
* **Status:** Marked with a red 'X'.
* **Content:**
* Step 1: "To solve the problem, we need to find the point where the number of bats equals the number of mosquitoes, other than the known 0 cm of rainfall."
* Step 2: "1. **Identify the equations for mosquitoes and bats**: - Mosquitoes: ( y = 5x - x²) - Bats: ( y = 3x - 0.5x² )"
* Step 3: "2. **Set the equations equal to each other to find the points of intersection**: [ 5x - x² = 3x - 0.5 x² ]"
* Step 4: "3 **Simplify the equation**: [ 5x - x² = 3x - 0.5 x² ] Rearrange the equation to collect like terms: [ 5x - = x - x² + 0.5x² = 0 ] [ 5x - = x + 0.5x² - x² = 0 ] [ 5x - = x - 0.5x² = 0 ] [ 5x - = x - 0.5x² = 0 ] [ 5x - = x - 0.5x² = 0 ]"
**4. Refined Solution (Middle Right)**
* **Status:** Marked with green checkmarks.
* **Content:**
* Step 4: "3. **Simplify the equation**: [ 5x - x² = 3x - 0.5x² ] Rearrange the equation to collect like terms: [ 5x - x² - = x + 0.5x² = 0 ] [ 2x - 0.5x² = 0 ] [ 0.5x² - 2x = 0 ] [ x(0.5x - 2) = 0 ] This corrected simplification should lead to the correct roots for further analysis."
* Step 5: "**Solve for ( x )**: [ x(0.5x - 2) = 0 ] This gives us two possible solutions for ( x ): 1. ( x = 0 ) 2. ( 0.5x - 2 = 0 ) [ 0.5x = 2 ] [ x = 4 ]"
* Step 8: "Final answer: ( 4 ) cm."
**5. GM-PRM: Analysis & Judgement (Bottom Left)**
* **Content:**
* "Step intent analysis: This step simplifies the equation set in Step 3 to prepare it for solving."
* "Image alignment analysis: The simplification process should reflect the intersection points seen in the image."
* "Reasoning logic analysis: There is a mistake in the simplification process. The rearrangement and simplification steps contain errors in algebraic manipulation."
### Detailed Analysis
* **Algebraic Logic:** The problem requires finding the intersection of two parabolas. This is achieved by setting the equations equal: $5x - x^2 = 3x - 0.5x^2$.
* **Simplification:**
* Subtracting $(3x - 0.5x^2)$ from both sides yields: $2x - 0.5x^2 = 0$.
* Factoring out $x$ yields: $x(2 - 0.5x) = 0$.
* The roots are $x = 0$ and $2 - 0.5x = 0 \rightarrow 0.5x = 2 \rightarrow x = 4$.
* **Visual Verification:** The graph shows the blue and magenta lines crossing at the origin $(0,0)$ and again at $x=4$ on the horizontal axis. The height at $x=4$ for both equations is $y = 5(4) - 4^2 = 20 - 16 = 4$, and $y = 3(4) - 0.5(4^2) = 12 - 8 = 4$. The visual data matches the algebraic result.
### Key Observations
* **Error Identification:** The "Original Solution" fails due to garbled algebraic manipulation and incorrect sign handling during the rearrangement of terms.
* **Pedagogical Structure:** The image uses a "Critique-Correction" format. It highlights the error, provides a meta-analysis of *why* it is an error (GM-PRM box), and then provides the correct path.
* **Consistency:** The graph, the refined algebraic steps, and the final answer are all consistent with each other.
### Interpretation
This image is a diagnostic tool for mathematical reasoning. It demonstrates that solving for the intersection of two functions is equivalent to finding the roots of the difference between those functions. The inclusion of the "GM-PRM" (likely "Generative Model - Process Reasoning Module") box suggests this is an output from an AI system designed to self-correct or provide transparent reasoning. The "Original Solution" serves as a negative example, illustrating how algebraic errors (specifically in collecting like terms) lead to incorrect or nonsensical results, while the "Refined Solution" demonstrates the correct procedural flow.