## Line Chart: GOLD/USD, BTC/SD, and S&P500 Performance (2015-2022)
### Overview
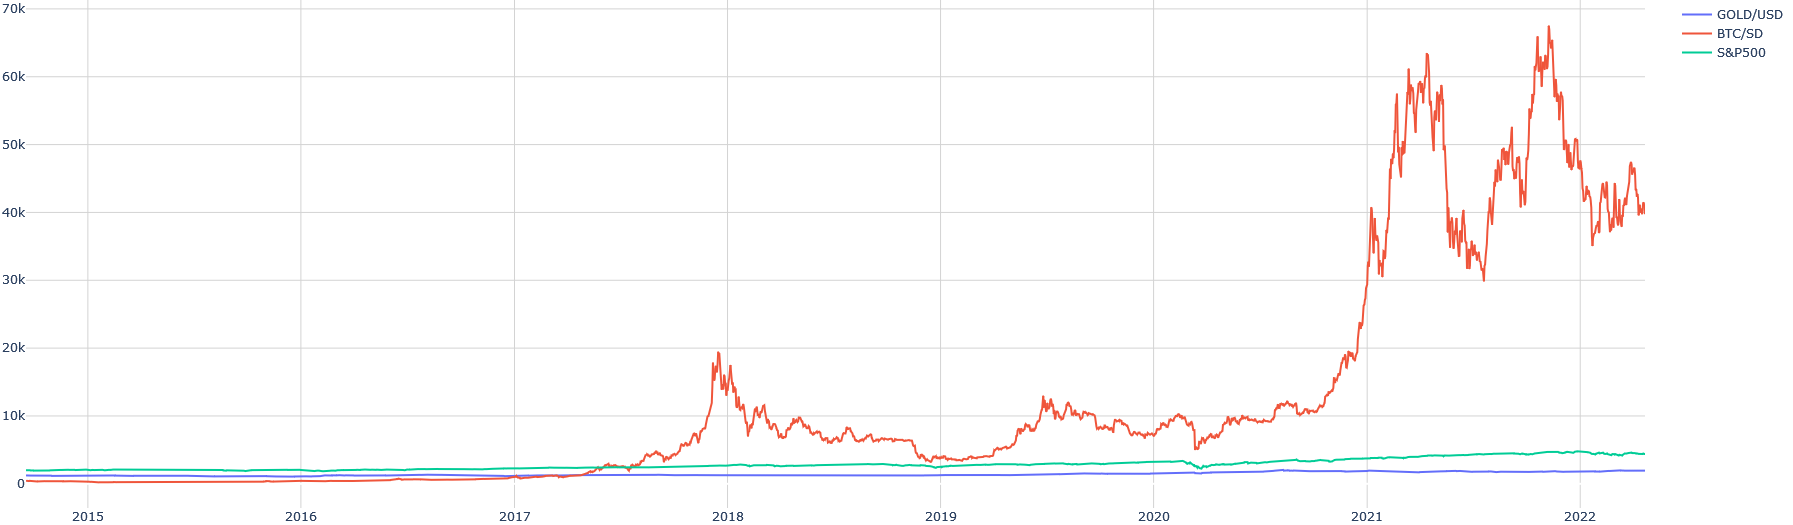
The image is a line chart comparing the performance of GOLD/USD, BTC/SD (Bitcoin), and the S&P500 index from 2015 to 2022. The chart displays the price trends of these three assets over time, with the y-axis representing price in thousands (k) and the x-axis representing the year.
### Components/Axes
* **X-axis:** Represents time, labeled with years from 2015 to 2022.
* **Y-axis:** Represents price in thousands (k), with markers at 0, 10k, 20k, 30k, 40k, 50k, 60k, and 70k.
* **Legend (Top-Right):**
* Blue line: GOLD/USD
* Red line: BTC/SD
* Green line: S&P500
### Detailed Analysis
* **GOLD/USD (Blue Line):**
* Trend: Relatively stable with a slight upward trend.
* Approximate Values: Starts around 1.1k in 2015 and ends around 1.8k in 2022.
* **BTC/SD (Red Line):**
* Trend: Highly volatile with significant price increases, especially after 2020.
* Approximate Values: Starts around 0.3k in 2015, experiences a spike to approximately 18k in early 2018, then fluctuates between 6k and 12k until 2020. After 2020, it rises dramatically, peaking at approximately 65k in late 2021, before declining to around 38k in 2022.
* **S&P500 (Green Line):**
* Trend: Steady upward trend.
* Approximate Values: Starts around 2.1k in 2015 and ends around 4.0k in 2022.
### Key Observations
* BTC/SD shows the most significant price fluctuations and overall growth compared to GOLD/USD and S&P500.
* GOLD/USD exhibits the least volatility and the smallest overall growth.
* S&P500 demonstrates a consistent, moderate growth rate.
* The period after 2020 shows a significant divergence in performance, with BTC/SD experiencing exponential growth and subsequent decline.
### Interpretation
The chart illustrates the differing investment profiles of gold, Bitcoin, and the S&P500. Bitcoin's high volatility and potential for high returns are evident, while gold offers stability and lower returns. The S&P500 provides a balance between risk and return, with steady growth over the period. The dramatic rise and fall of Bitcoin after 2020 highlights the speculative nature of cryptocurrency investments. The data suggests that Bitcoin's performance is largely independent of the other two assets, while gold and the S&P500 show a more consistent, albeit less dramatic, growth pattern.