\n
## Line Chart: Asset Price Comparison (2015-2022)
### Overview
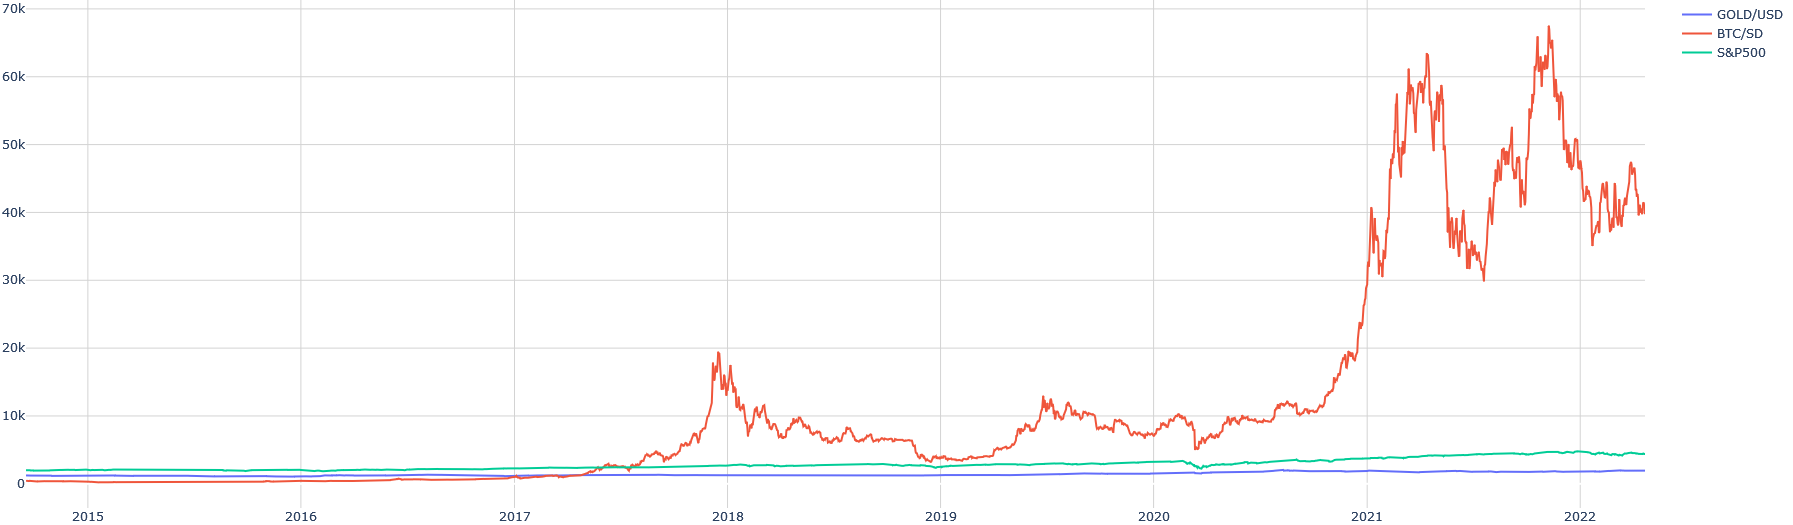
This image presents a line chart comparing the price trends of three assets – Gold (GOLD/USD), Bitcoin (BTC/USD), and the S&P 500 (S&P500) – over the period from 2015 to 2022. The chart displays price on the y-axis and time (years) on the x-axis.
### Components/Axes
* **X-axis:** Represents time, spanning from 2015 to 2022. Markers are present for each year.
* **Y-axis:** Represents price, scaled from 0 to 70,000. The scale is linear.
* **Legend:** Located in the top-right corner, identifying each line:
* GOLD/USD (Blue)
* BTC/USD (Red)
* S&P500 (Teal/Green)
### Detailed Analysis
The chart displays three distinct price trends.
* **GOLD/USD (Blue Line):** The blue line representing Gold exhibits a relatively flat trend throughout the period. It starts at approximately 1,100 in 2015 and ends around 1,800 in 2022. There is a slight upward slope, but the overall change is modest.
* **BTC/USD (Red Line):** The red line representing Bitcoin shows a dramatic increase in price. Starting near 200 in 2015, it experiences periods of growth and decline. A significant surge occurs around 2017, peaking at approximately 20,000. After a correction, it rises sharply again in 2021, reaching a peak of around 69,000. The price then declines to approximately 40,000 by the end of 2022.
* **S&P500 (Teal/Green Line):** The teal line representing the S&P 500 shows a consistent upward trend, though less volatile than Bitcoin. It begins around 2,000 in 2015 and rises to approximately 4,000 by the end of 2022. There is a dip in early 2020, likely corresponding to the start of the COVID-19 pandemic, followed by a strong recovery.
**Approximate Data Points (extracted visually):**
| Year | GOLD/USD | BTC/USD | S&P500 |
|---|---|---|---|
| 2015 | 1,100 | 200 | 2,000 |
| 2016 | 1,200 | 900 | 2,200 |
| 2017 | 1,300 | 20,000 | 2,400 |
| 2018 | 1,250 | 13,000 | 2,700 |
| 2019 | 1,350 | 7,000 | 3,100 |
| 2020 | 1,900 | 9,000 | 3,200 (dip to ~2,200) |
| 2021 | 1,800 | 69,000 | 4,700 |
| 2022 | 1,800 | 40,000 | 4,000 |
### Key Observations
* Bitcoin exhibits significantly higher volatility compared to Gold and the S&P 500.
* The S&P 500 demonstrates a steady, long-term growth trend.
* Gold's price remains relatively stable throughout the period, acting as a potential safe-haven asset.
* The most significant price surge for Bitcoin occurred between 2020 and 2021.
* The S&P 500 experienced a temporary decline in early 2020, but quickly recovered.
### Interpretation
The chart illustrates the differing risk-reward profiles of these three assets. Bitcoin, while offering the potential for substantial gains, also carries a high degree of risk due to its volatility. Gold, on the other hand, provides relative stability but with limited growth potential. The S&P 500 represents a more balanced approach, offering steady growth with moderate risk.
The data suggests a period of increased risk appetite in the market, particularly during 2020-2021, as evidenced by the surge in Bitcoin's price. The dip in the S&P 500 in early 2020 likely reflects the initial uncertainty surrounding the COVID-19 pandemic, while the subsequent recovery indicates a return to investor confidence. Gold's stable performance throughout the period suggests its role as a hedge against economic uncertainty.
The chart provides a snapshot of asset performance over a specific timeframe and should not be interpreted as a prediction of future trends. Market conditions can change rapidly, and past performance is not necessarily indicative of future results.