## Line Chart: Cryptocurrency and Financial Market Performance (2015-2022)
### Overview
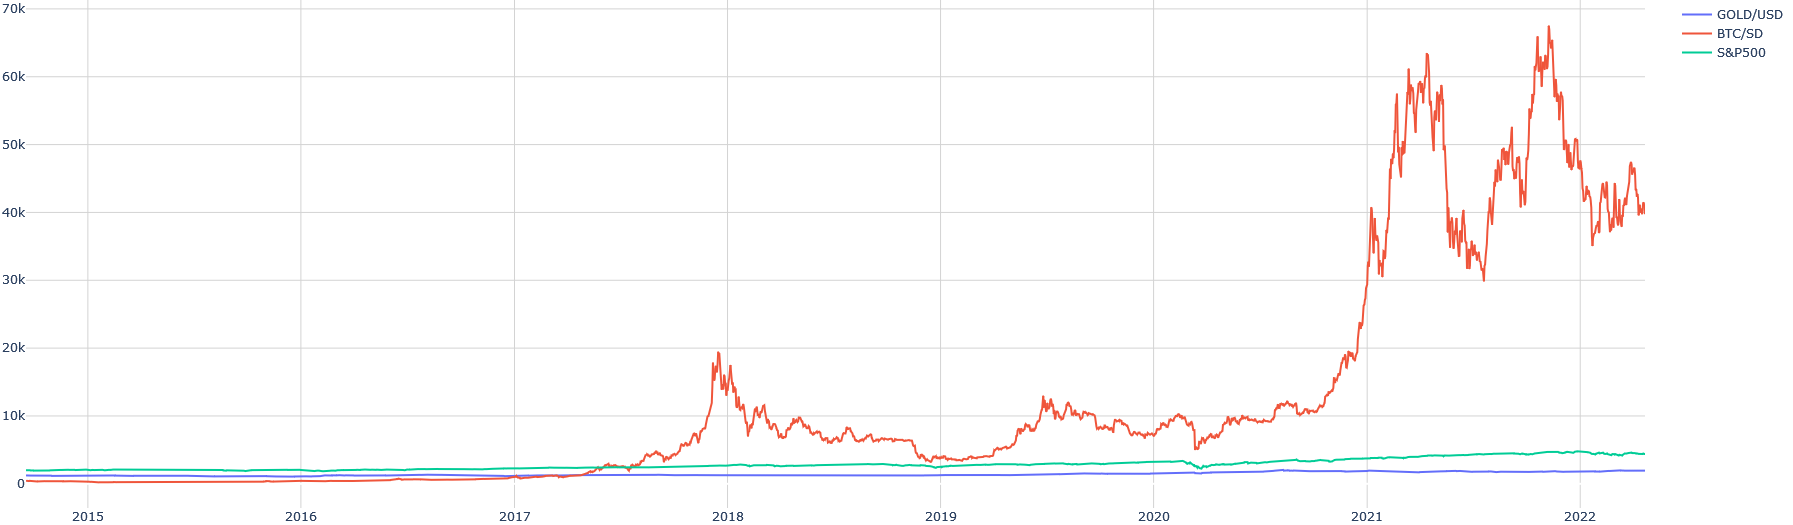
The chart displays three financial assets' price movements over eight years: gold (GOLD/USD), Bitcoin (BTC/SD), and the S&P500 index. The y-axis represents price in USD, while the x-axis spans 2015-2022. Three distinct lines show divergent volatility patterns.
### Components/Axes
- **X-axis**: Time (2015-2022), marked annually
- **Y-axis**: Price (USD), scaled 0-70,000
- **Legend**: Right-aligned, color-coded:
- Blue: GOLD/USD
- Red: BTC/SD
- Green: S&P500
- **Grid**: Light gray lines with 10,000 USD increments
### Detailed Analysis
1. **GOLD/USD (Blue Line)**
- Flat line between 1,200-1,300 USD throughout 2015-2022
- Minor fluctuations (±50 USD) with no significant trend
- Spatial grounding: Bottom-most line, consistently near y=1,250
2. **BTC/SD (Red Line)**
- 2015-2016: Near-zero value (~100 USD)
- 2017: Sharp rise to ~20,000 USD, followed by 70% correction
- 2018: Volatile consolidation between 3,000-10,000 USD
- 2019-2020: Gradual increase to ~10,000 USD
- 2021: Parabolic surge to ~65,000 USD (peak), then 38% correction
- 2022: Recovery to ~40,000 USD with continued volatility
- Spatial grounding: Dominates upper chart space post-2017
3. **S&P500 (Green Line)**
- 2015-2016: Stable ~2,000-2,200 USD
- 2017-2018: Gradual rise to ~2,800 USD
- 2019-2020: Sharp increase to ~4,000 USD during pandemic
- 2021: Peaks at ~4,500 USD, then declines to ~3,800 USD
- Spatial grounding: Middle line, shows steady upward trend until 2021
### Key Observations
- BTC/SD exhibits extreme volatility (100x increase from 2015-2021)
- S&P500 shows 100% total return over 8 years with accelerated growth post-2020
- GOLD/USD remains remarkably stable despite macroeconomic changes
- BTC/SD's 2021 peak (~65,000 USD) approaches but doesn't reach y-axis maximum
- S&P500's 2021 peak correlates with BTC/SD's surge, suggesting market correlation
### Interpretation
The chart reveals divergent risk profiles:
1. **BTC/SD** demonstrates speculative asset characteristics with 100x+ volatility
2. **S&P500** reflects traditional market growth with pandemic-era acceleration
3. **GOLD/USD** maintains safe-haven status with minimal volatility
4. 2021 correlation between crypto and equities suggests macroeconomic drivers
5. BTC/SD's 2022 correction (38% from peak) indicates renewed volatility despite prior gains
The data suggests BTC/SD as a high-risk/high-reward asset, S&P500 as a growth benchmark, and gold as a stability anchor. The 2021 synchronized rally across all assets may indicate broader market optimism, while BTC/SD's 2022 correction highlights crypto-specific risks.