## Bar Chart: Distribution of news outlets' political orientation
### Overview
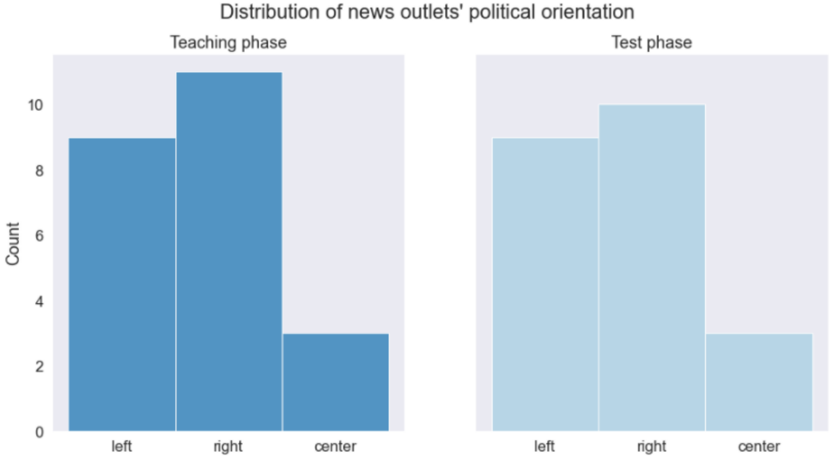
The image presents two bar charts side-by-side, illustrating the distribution of news outlets' political orientation during a "Teaching phase" and a "Test phase." The x-axis represents political orientation (left, right, center), and the y-axis represents the count of news outlets. The "Teaching phase" chart uses a darker blue, while the "Test phase" chart uses a lighter blue.
### Components/Axes
* **Title:** Distribution of news outlets' political orientation
* **X-axis:** Political orientation (left, right, center)
* **Y-axis:** Count (0 to 10, increments of 2)
* **Chart 1 Title:** Teaching phase
* **Chart 2 Title:** Test phase
* **Color:** Darker blue for "Teaching phase", Lighter blue for "Test phase"
### Detailed Analysis
**Teaching Phase (Darker Blue):**
* **Left:** Approximately 9
* **Right:** Approximately 11
* **Center:** Approximately 3
**Test Phase (Lighter Blue):**
* **Left:** Approximately 9
* **Right:** Approximately 10
* **Center:** Approximately 3
### Key Observations
* In the Teaching phase, the "right" category has the highest count, followed by "left" and then "center."
* In the Test phase, the "right" category has the highest count, followed by "left" and then "center."
* The distribution is similar between the two phases, with a slight decrease in the "right" category and a slight increase in the "left" category in the Test phase compared to the Teaching phase.
* The "center" category remains relatively constant between the two phases.
### Interpretation
The charts suggest that the distribution of news outlets' political orientation is skewed towards the "right" and "left," with fewer outlets identified as "center." The similarity between the "Teaching phase" and "Test phase" distributions implies a consistent pattern in the data. The slight shift from "right" to "left" between the phases could indicate a subtle change in the political orientation of the news outlets being analyzed. The data does not provide information on the specific criteria used to classify outlets as "left," "right," or "center."