\n
## Bar Chart: Distribution of News Outlets' Political Orientation
### Overview
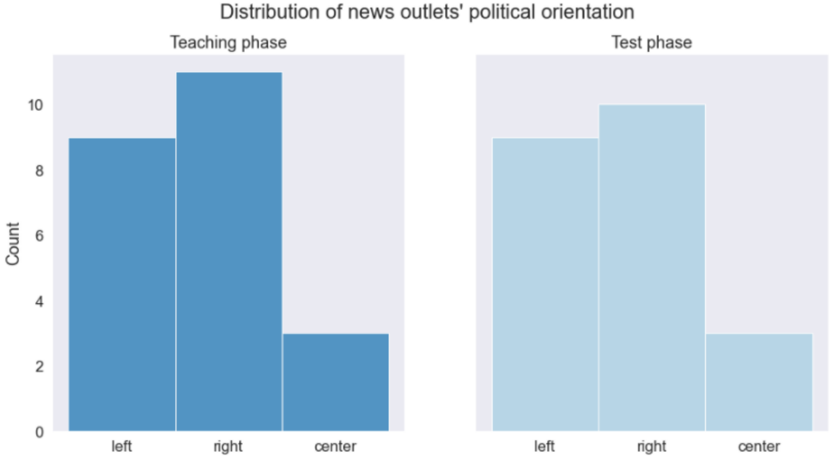
This image presents a bar chart comparing the distribution of news outlets' political orientation during a "Teaching phase" and a "Test phase". The chart displays the count of news outlets categorized as "left", "right", or "center" for each phase.
### Components/Axes
* **Title:** "Distribution of news outlets' political orientation" (centered at the top)
* **X-axis Label:** Political Orientation (with categories: "left", "right", "center")
* **Y-axis Label:** Count (ranging from 0 to 10)
* **Sub-Titles:** "Teaching phase" (above the left bar chart) and "Test phase" (above the right bar chart)
* **Bar Colors:** Blue for the "Teaching phase" and light blue for the "Test phase".
### Detailed Analysis
The chart consists of two sets of three bars, one for each phase.
**Teaching Phase (Blue Bars):**
* **Left:** The bar representing "left" orientation reaches approximately 9 on the count axis.
* **Right:** The bar representing "right" orientation reaches approximately 11 on the count axis.
* **Center:** The bar representing "center" orientation reaches approximately 3 on the count axis.
**Test Phase (Light Blue Bars):**
* **Left:** The bar representing "left" orientation reaches approximately 7 on the count axis.
* **Right:** The bar representing "right" orientation reaches approximately 10 on the count axis.
* **Center:** The bar representing "center" orientation reaches approximately 3 on the count axis.
### Key Observations
* In both phases, the "right" orientation has the highest count of news outlets.
* The "center" orientation has the lowest count in both phases.
* The count of "left" oriented news outlets is slightly lower in the "Test phase" compared to the "Teaching phase".
* The count of "right" oriented news outlets is approximately the same in both phases.
### Interpretation
The data suggests that the news outlets included in this study are predominantly oriented towards the "right" side of the political spectrum in both the teaching and test phases. The relatively low count of "center" oriented outlets indicates a potential bias in the sample. The slight decrease in "left" oriented outlets from the teaching to the test phase could indicate a shift or filtering process during the testing phase, but further investigation would be needed to confirm this. The consistency in the "right" orientation count suggests a stable representation of this political leaning throughout both phases. The chart provides a snapshot of the political landscape of the news outlets being analyzed, which could be relevant for understanding potential biases in news coverage or the composition of a media dataset.