## Bar Chart: Distribution of News Outlets' Political Orientation
### Overview
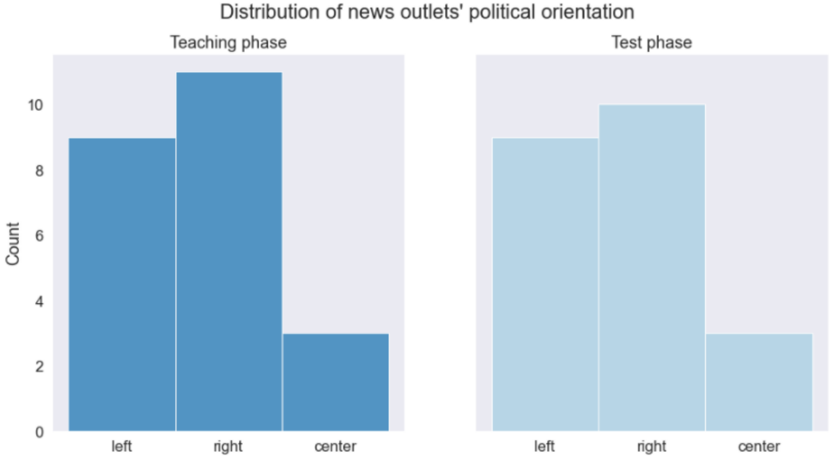
The image displays a comparative bar chart titled "Distribution of news outlets' political orientation." It consists of two side-by-side subplots representing two distinct phases: a "Teaching phase" on the left and a "Test phase" on the right. Each subplot shows the count of news outlets categorized into three political orientations: left, right, and center.
### Components/Axes
* **Main Title:** "Distribution of news outlets' political orientation" (centered at the top).
* **Subplot Titles:**
* Left subplot: "Teaching phase"
* Right subplot: "Test phase"
* **Y-Axis:**
* Label: "Count" (rotated vertically on the far left).
* Scale: Linear, with major tick marks at 0, 2, 4, 6, 8, and 10.
* **X-Axis (for both subplots):**
* Categories: "left", "right", "center" (listed in that order from left to right).
* **Data Series (Bars):**
* **Teaching Phase:** Represented by darker blue bars.
* **Test Phase:** Represented by lighter blue bars.
* *Note: There is no explicit legend box. The phase distinction is made via the subplot titles and the consistent color difference between the two sets of bars.*
### Detailed Analysis
**Teaching Phase (Left Subplot, Darker Blue Bars):**
* **Trend:** The distribution is uneven, with "right" being the most frequent category, followed by "left," and "center" being the least frequent.
* **Data Points (Approximate):**
* **left:** The bar height aligns with the midpoint between 8 and 10 on the y-axis. **Approximate Count: 9.**
* **right:** The bar height is slightly above the 10 mark. **Approximate Count: 11.**
* **center:** The bar height aligns with the midpoint between 2 and 4. **Approximate Count: 3.**
**Test Phase (Right Subplot, Lighter Blue Bars):**
* **Trend:** The distribution pattern is similar to the Teaching phase, with "right" being the most frequent, followed by "left," and "center" the least. The counts for "left" and "right" appear slightly lower than in the Teaching phase.
* **Data Points (Approximate):**
* **left:** The bar height aligns with the midpoint between 8 and 10. **Approximate Count: 9.**
* **right:** The bar height aligns exactly with the 10 mark. **Approximate Count: 10.**
* **center:** The bar height aligns with the midpoint between 2 and 4. **Approximate Count: 3.**
| Category | Teaching Phase (Approx. Count) | Test Phase (Approx. Count) |
| :--- | :--- | :--- |
| **left** | 9 | 9 |
| **right** | 11 | 10 |
| **center** | 3 | 3 |
### Key Observations
1. **Consistent Hierarchy:** In both phases, the order of frequency is identical: Right > Left > Center.
2. **Stability of "Center":** The count for "center"-oriented outlets remains constant at approximately 3 across both phases.
3. **Minor Shift in Dominant Category:** The count for "right"-oriented outlets decreases slightly from approximately 11 in the Teaching phase to 10 in the Test phase.
4. **Stability of "Left":** The count for "left"-oriented outlets appears stable at approximately 9 in both phases.
5. **Visual Encoding:** The chart uses spatial separation (two subplots) and color saturation (darker vs. lighter blue) to distinguish between the two experimental phases, rather than a traditional legend.
### Interpretation
This chart visualizes the composition of a dataset of news outlets used in what appears to be a two-phase study (Teaching and Test). The data suggests the dataset is not politically balanced; it is skewed towards right-leaning outlets, with left-leaning outlets also well-represented, and centrist outlets being a distinct minority.
The primary finding is the **high degree of distributional stability** between the Teaching and Test phases. The near-identical counts, especially for the "left" and "center" categories, indicate that the experimental manipulation (the shift from teaching to testing) did not significantly alter the underlying political makeup of the outlet pool being analyzed. The slight decrease in the "right" category could be a minor artifact of sampling or a very subtle effect, but the overall pattern is one of consistency. This stability is crucial for an experiment, as it suggests that any differences in outcomes between phases are likely due to the experimental conditions themselves, not a change in the stimulus material's political bias.