## Chart: Neuron Activation Distribution
### Overview
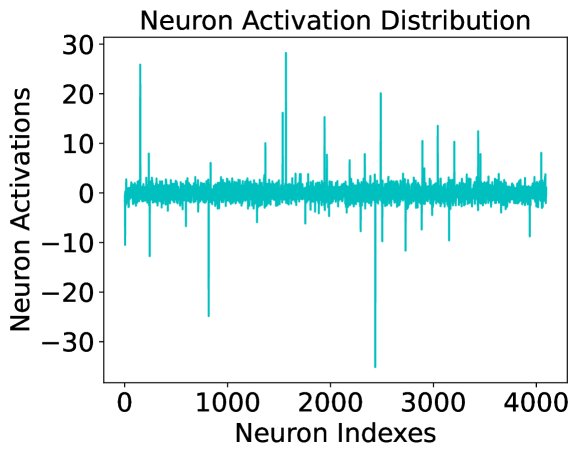
The image is a line chart displaying the distribution of neuron activations across a range of neuron indexes. The chart shows the activation levels of individual neurons, with several spikes and dips indicating varying levels of activity.
### Components/Axes
* **Title:** Neuron Activation Distribution
* **X-axis:** Neuron Indexes
* Scale: 0 to 4000, with markers at 0, 1000, 2000, 3000, and 4000.
* **Y-axis:** Neuron Activations
* Scale: -30 to 30, with markers at -30, -20, -10, 0, 10, 20, and 30.
* **Data Series:** A single turquoise line representing the neuron activation levels.
### Detailed Analysis
The turquoise line represents the activation levels of neurons. The line fluctuates around the 0 activation level, with several significant positive and negative spikes.
* **General Trend:** The line generally hovers around the 0 mark, indicating that most neurons have low activation levels.
* **Positive Spikes:**
* A spike near index 100 reaches approximately 27.
* A spike near index 1400 reaches approximately 28.
* A spike near index 2600 reaches approximately 20.
* A spike near index 3400 reaches approximately 12.
* **Negative Spikes:**
* A dip near index 800 reaches approximately -12.
* A dip near index 2200 reaches approximately -35.
* A dip near index 3000 reaches approximately -10.
### Key Observations
* Most neurons have activation levels close to zero.
* A few neurons exhibit significantly higher or lower activation levels, indicated by the spikes and dips.
* The distribution appears relatively uniform across the neuron indexes, with no specific region showing consistently higher or lower activation.
### Interpretation
The chart illustrates the activation patterns within a neural network layer. The presence of spikes and dips suggests that certain neurons are more responsive to the input data than others. The overall distribution indicates that the network might be sparsely activated, with only a small subset of neurons actively contributing to the computation. The large negative spike at index 2200 could indicate a neuron that is actively suppressing certain features or patterns. The distribution of neuron activations can be used to diagnose potential issues in the network, such as dead neurons or vanishing gradients, and to optimize the network's performance.