\n
## Line Chart: Neuron Activation Distribution
### Overview
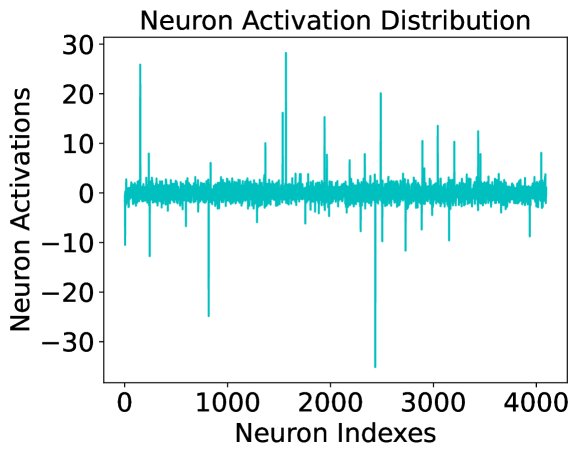
The image presents a line chart visualizing the distribution of neuron activations across neuron indices. The chart displays a fluctuating pattern of activation values, ranging from negative to positive, with a generally centered around zero.
### Components/Axes
* **Title:** "Neuron Activation Distribution" - positioned at the top-center of the chart.
* **X-axis:** "Neuron Indexes" - ranging from approximately 0 to 4000, with tick marks at regular intervals.
* **Y-axis:** "Neuron Activations" - ranging from approximately -30 to 30, with tick marks at intervals of 10.
* **Data Series:** A single teal-colored line representing the neuron activation values.
### Detailed Analysis
The line chart shows a highly variable pattern of neuron activations. The line fluctuates significantly above and below the zero activation level.
Here's a breakdown of approximate values at specific neuron indices:
* **Neuron Index 0:** Activation is approximately +25.
* **Neuron Index 500:** Activation is approximately -25.
* **Neuron Index 1000:** Activation is approximately -30.
* **Neuron Index 1500:** Activation is approximately +15.
* **Neuron Index 2000:** Activation is approximately +10.
* **Neuron Index 2500:** Activation is approximately +20.
* **Neuron Index 3000:** Activation is approximately -10.
* **Neuron Index 3500:** Activation is approximately +5.
* **Neuron Index 4000:** Activation is approximately -5.
The line generally oscillates around the zero activation level, but with varying amplitude. There are several instances of high positive and negative activations. The trend is not consistently upward or downward, but rather appears random with localized peaks and troughs.
### Key Observations
* The activation values are distributed symmetrically around zero, suggesting a balanced distribution of excitatory and inhibitory signals.
* There are several outliers with activation values exceeding ±20.
* The fluctuations in activation values appear to be relatively independent of the neuron index, indicating that there is no clear spatial pattern in the activation distribution.
### Interpretation
The chart suggests that the neurons are exhibiting a diverse range of activation levels. The random fluctuations indicate that the neurons are responding to varying inputs or are involved in complex processing. The symmetrical distribution around zero suggests a balance between excitation and inhibition, which is crucial for stable neural computation. The outliers may represent neurons that are particularly sensitive to certain inputs or are involved in critical processing steps. The lack of a clear spatial pattern suggests that the activation distribution is not organized in a simple, linear fashion. This could indicate a distributed and parallel processing scheme. The data suggests a dynamic and complex neural system, where individual neurons exhibit varying levels of activity in response to stimuli or internal processes.