## Line Chart: Neuron Activation Distribution
### Overview
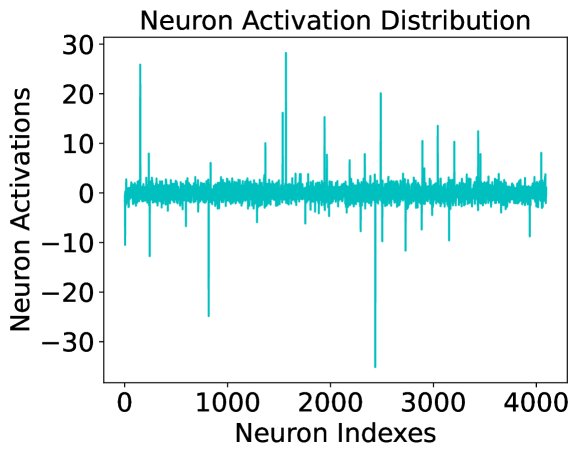
The image displays a line chart titled "Neuron Activation Distribution." It plots the activation values of approximately 4,000 individual neurons, indexed sequentially along the horizontal axis. The data is presented as a single, dense, teal-colored line that fluctuates around a central baseline, with several prominent positive and negative spikes.
### Components/Axes
* **Title:** "Neuron Activation Distribution" (centered at the top).
* **Y-Axis (Vertical):**
* **Label:** "Neuron Activations"
* **Scale:** Linear scale ranging from -30 to 30.
* **Tick Marks:** Labeled at intervals of 10: -30, -20, -10, 0, 10, 20, 30.
* **X-Axis (Horizontal):**
* **Label:** "Neuron Indexes"
* **Scale:** Linear scale from 0 to 4000.
* **Tick Marks:** Labeled at intervals of 1000: 0, 1000, 2000, 3000, 4000.
* **Data Series:** A single series represented by a teal-colored line. There is no legend, as only one dataset is plotted.
### Detailed Analysis
The chart visualizes the activation magnitude for each neuron in a sequence. The core pattern is a dense, noisy band of activations centered tightly around 0, with a typical range of approximately -5 to +5. This baseline activity is punctuated by numerous sharp, high-magnitude spikes.
**Key Data Points & Trends (Approximate):**
* **General Trend:** The line does not show a consistent upward or downward slope across the entire index range. Instead, it exhibits a stationary pattern of low-amplitude noise with intermittent, high-amplitude outliers.
* **Notable Positive Spikes (Activations > 10):**
* Near index ~200: Spike to ~25.
* Near index ~1500: The highest positive spike, reaching ~28.
* Near index ~2000: Spike to ~15.
* Near index ~2500: Spike to ~20.
* Near index ~3000: Spike to ~14.
* Near index ~3500: Spike to ~12.
* **Notable Negative Spikes (Activations < -10):**
* Near index ~800: Spike down to ~-25.
* Near index ~2500: The most extreme negative spike, reaching approximately -35 (extending below the -30 axis label).
* Several other spikes reach between -10 and -20 at various points (e.g., near index ~500, ~1800, ~2800).
### Key Observations
1. **Sparse High Activation:** The vast majority of neurons have low activation values near zero. Strong activations (both positive and negative) are sparse events, occurring for only a small fraction of the neuron indexes.
2. **Symmetry of Outliers:** High-magnitude events occur in both the positive and negative directions, though the single most extreme value is negative (~-35).
3. **No Clear Index-Based Pattern:** The high-activation neurons do not appear to cluster in specific index ranges; they are distributed seemingly randomly across the 0-4000 index span.
4. **Baseline Noise:** The persistent low-level fluctuation around zero suggests a background level of activity or noise across the entire neural population.
### Interpretation
This chart likely represents the output of a layer in a neural network (e.g., a hidden layer or embedding layer) for a specific input or averaged over inputs. The distribution suggests a **sparse coding** or **efficient representation** scheme.
* **What it demonstrates:** The network encodes information primarily through the rare, high-magnitude activation of specific neurons, while most neurons remain relatively inactive. This is a common characteristic in well-trained models, where specialization leads to sparse representations.
* **Relationship between elements:** The "Neuron Indexes" represent individual processing units. The "Activation" value indicates the strength of that unit's response. The pattern shows that the system's response is concentrated in a few key units.
* **Notable anomalies:** The extreme negative spike near index 2500 is the most significant outlier. In a technical context, this could indicate a neuron with a strong inhibitory response, a potential dead neuron (if activations are typically positive), or simply a highly specialized detector for a specific feature in the input data. The lack of clustering suggests the learned features are distributed across the network's width rather than being localized to specific index blocks.