## Line Chart: Neuron Activation Distribution
### Overview
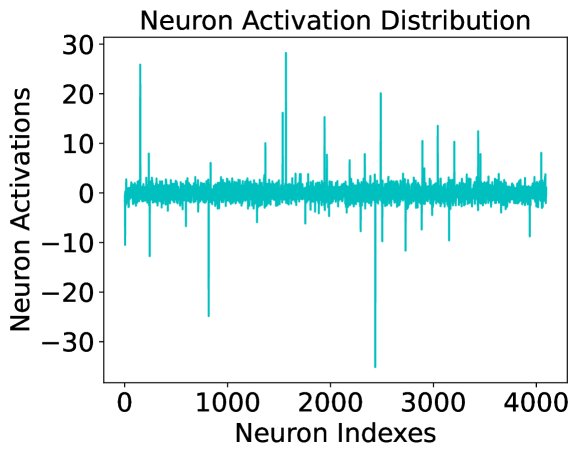
The image depicts a line chart titled "Neuron Activation Distribution," visualizing neuron activation values across a range of neuron indexes. The chart features a single cyan-colored line representing activation data, with fluctuations in activation levels across the neuron indexes.
### Components/Axes
- **Title**: "Neuron Activation Distribution" (centered at the top).
- **X-Axis**: Labeled "Neuron Indexes," scaled from 0 to 4000 in increments of 1000.
- **Y-Axis**: Labeled "Neuron Activations," scaled from -30 to 30 in increments of 10.
- **Legend**: No explicit legend is visible in the image. The cyan line is the sole data series.
- **Line**: A single cyan line traversing the chart, with no markers or annotations.
### Detailed Analysis
- **Neuron Indexes (X-Axis)**: The horizontal axis spans 0 to 4000, with evenly spaced tick marks at 0, 1000, 2000, 3000, and 4000.
- **Neuron Activations (Y-Axis)**: The vertical axis ranges from -30 to 30, with values distributed symmetrically around zero.
- **Line Behavior**: The cyan line exhibits significant variability, with peaks reaching approximately +25 and troughs dipping to around -25. The line oscillates irregularly, showing no consistent upward or downward trend. Notable spikes occur near neuron indexes 500, 1500, 2500, and 3500, while deeper troughs are observed near 1000 and 3000.
### Key Observations
1. **High Variability**: Activation values fluctuate widely, with no clear pattern or correlation between adjacent neuron indexes.
2. **Outliers**: Peaks and troughs exceed the typical range of ±10, suggesting sporadic high or low activation events.
3. **Symmetry**: The distribution of activations is roughly symmetric around zero, indicating balanced positive and negative activation events.
### Interpretation
The chart suggests a heterogeneous distribution of neuron activations, with individual neurons exhibiting diverse activation levels. The lack of a systematic trend implies that neuron activity is either uncorrelated or influenced by external factors not represented in the data. The outliers (extreme peaks/troughs) could represent neurons with heightened or suppressed activity, potentially critical for specific neural processes. The symmetry around zero may indicate a baseline activation state, with deviations reflecting dynamic responses. This distribution could be relevant to studies of neural plasticity, signal processing, or pathological conditions involving abnormal neural firing patterns.