## Diagram: Process Flow Comparison
### Overview
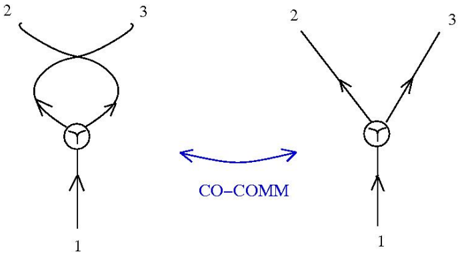
The image depicts two interconnected diagrams labeled "CO-COMM" (communication) via a bidirectional blue arrow. The left diagram shows a cyclic process with feedback loops, while the right diagram illustrates a linear branching process. Both share a central node with three labeled arrows (1, 2, 3).
### Components/Axes
- **Left Diagram**:
- Central node with three outgoing arrows:
- Arrow 1: Downward (linear path).
- Arrows 2 and 3: Curved upward, forming a feedback loop back to the central node.
- No explicit axis labels or scales.
- **Right Diagram**:
- Central node with three diverging arrows:
- Arrow 1: Downward (linear path).
- Arrows 2 and 3: Branching upward at 45° angles.
- No explicit axis labels or scales.
- **Connecting Element**:
- Blue bidirectional arrow labeled "CO-COMM" between the two diagrams.
### Detailed Analysis
- **Left Diagram**:
- Arrows 2 and 3 create a closed loop, suggesting iterative or recursive behavior.
- Arrow 1 represents a terminal or output path.
- **Right Diagram**:
- Arrows 2 and 3 diverge independently, indicating parallel or branching workflows.
- Arrow 1 mirrors the left diagram’s linear path.
- **CO-COMM Arrow**:
- Positioned centrally between the diagrams, implying bidirectional interaction or synchronization between the two processes.
### Key Observations
1. The left diagram emphasizes cyclical feedback (arrows 2/3), while the right prioritizes linear divergence (arrows 2/3).
2. Arrow 1 in both diagrams acts as a common output or termination point.
3. No numerical data or quantitative labels are present; the focus is on structural relationships.
### Interpretation
The diagrams likely represent two contrasting process models:
- **Left (Cyclic)**: Suitable for systems requiring continuous feedback (e.g., control loops, iterative algorithms).
- **Right (Linear)**: Represents decision trees or workflows with parallel paths.
- **CO-COMM**: Suggests these models interact or share information, possibly in hybrid systems (e.g., combining feedback with branching logic).
No numerical trends or outliers exist due to the absence of quantitative data. The diagrams emphasize structural logic over measurable metrics.