# Technical Document Extraction: Diagram Analysis
## Diagram Overview
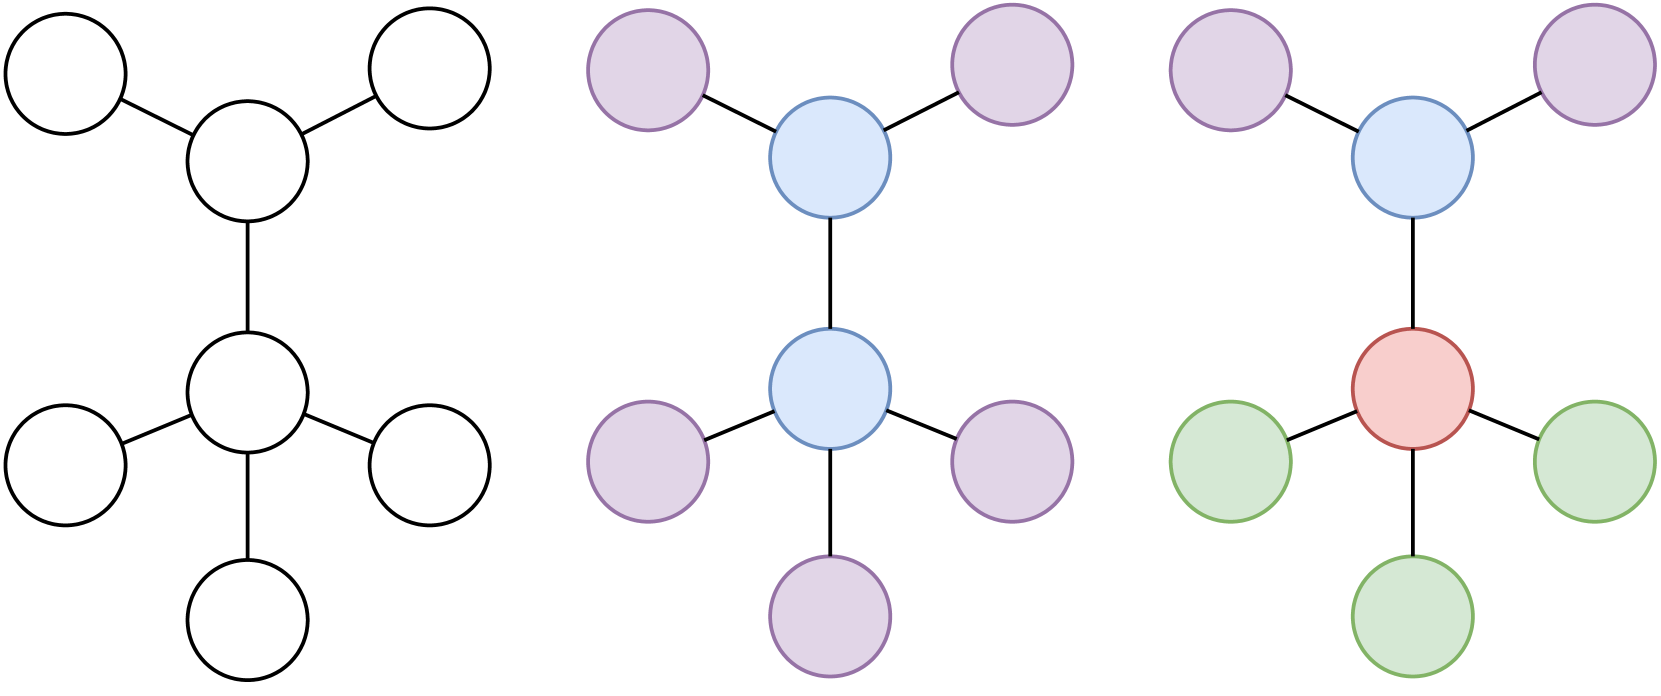
The image contains three hierarchical tree diagrams with identical structural patterns but distinct color codings. No textual labels, legends, or axis markers are present in the diagrams.
---
### Diagram 1: Monochrome Structure
- **Structure**:
- Root node (central position)
- Two child nodes branching from the root
- Each child node has two child nodes (total 4 leaf nodes)
- Total nodes: 7
- **Visual Characteristics**:
- Black outlines on white background
- No color differentiation between nodes
- Symmetrical branching pattern
---
### Diagram 2: Blue/Purple Color Coding
- **Structure**: Identical to Diagram 1
- **Color Scheme**:
- Root node: Blue (#87CEEB)
- First-level children: Purple (#9370DB)
- Second-level children: Purple (#9370DB)
- **Spatial Grounding**:
- Root node coordinates: [x_center, y_top]
- First-level children: [x_left, y_mid], [x_right, y_mid]
- Second-level children: [x_left_left, y_bottom], [x_left_right, y_bottom], [x_right_left, y_bottom], [x_right_right, y_bottom]
---
### Diagram 3: Red/Green Color Coding
- **Structure**: Identical to Diagram 1
- **Color Scheme**:
- Root node: Red (#FF6347)
- First-level children: Green (#90EE90)
- Second-level children: Green (#90EE90)
- **Spatial Grounding**:
- Root node coordinates: [x_center, y_top]
- First-level children: [x_left, y_mid], [x_right, y_mid]
- Second-level children: [x_left_left, y_bottom], [x_left_right, y_bottom], [x_right_left, y_bottom], [x_right_right, y_bottom]
---
### Key Observations
1. **Structural Consistency**: All diagrams share the same hierarchical pattern (root → 2 children → 4 grandchildren)
2. **Color Differentiation**:
- Diagram 2 uses blue/purple
- Diagram 3 uses red/green
3. **Absence of Data Elements**: No numerical values, legends, or axis markers present
4. **Symmetry**: All diagrams maintain perfect bilateral symmetry in node placement
---
### Technical Implications
These diagrams likely represent:
1. Organizational hierarchies
2. Decision trees
3. Network topologies
4. Classification systems
The color variations suggest potential use cases for:
- Visual distinction between hierarchical levels
- Categorization of nodes by type/role
- Comparative analysis across different classification schemes
---
### Limitations
- No explicit labels to confirm node meanings
- No scale indicators for potential quantitative interpretation
- No temporal or spatial context provided
---
### Conclusion
The diagrams demonstrate three equivalent hierarchical structures differentiated only by color coding. While the structural pattern remains constant, the color schemes may indicate different categorization approaches or visualization preferences for the same underlying system.