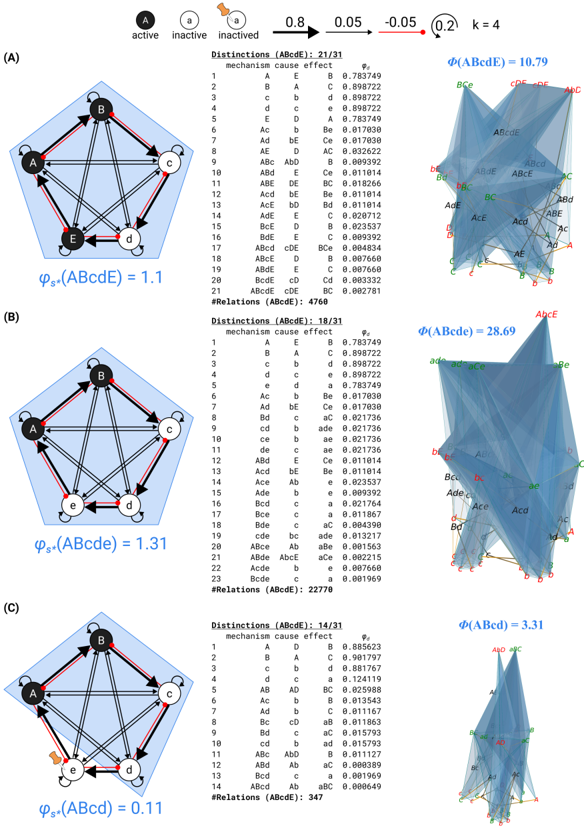
## Network Analysis Diagram: Multi-Node Interaction Systems
### Overview
The image presents a comparative analysis of three network systems (A, B, C) with interconnected nodes, statistical tables, and 3D interaction graphs. Each section demonstrates variations in node activation states, mechanism cause-effect relationships, and interaction complexity metrics (Φ values).
### Components/Axes
**Legend (Top Center):**
- Black circle: Active node
- Gray circle: Inactive node
- Red circle: Inactivated node
- Arrow colors: Black (positive influence), Red (negative influence)
**Section Layout:**
1. **Left Panel**: 2D network diagrams with nodes (A-E) and directional arrows
2. **Center Panel**: Tabular data showing mechanism cause-effect relationships
3. **Right Panel**: 3D interaction graphs with Φ values
**Key Numerical Values (Top Header):**
- 0.8 → 0.05 → -0.05 → 0.2
- k = 4 (constant across all sections)
### Detailed Analysis
**Section A:**
- **Network**: 5-node system (A-E) with 10 connections
- **Φ Value**: 10.79 (3D graph)
- **Table Data**: 21/31 distinctions with values ranging from 0.783749 to 0.998722
- **Key Relationships**:
- A→B: 0.783749
- B→C: 0.898722
- E→D: 0.898722
**Section B:**
- **Network**: Similar 5-node structure with modified connections
- **Φ Value**: 28.69 (3D graph)
- **Table Data**: 18/31 distinctions with values from 0.817039 to 0.997669
- **Notable Changes**:
- Increased negative influence (red arrows)
- New connection B→E: 0.897669
**Section C:**
- **Network**: 5-node system with altered topology
- **Φ Value**: 3.31 (3D graph)
- **Table Data**: 14/31 distinctions with values from 0.885623 to 0.999649
- **Key Observations**:
- Reduced negative influence
- New connection A→D: 0.885623
### Key Observations
1. **Φ Value Correlation**:
- Section B shows highest complexity (Φ=28.69) despite fewer connections
- Section C demonstrates lowest complexity (Φ=3.31) with simplified topology
2. **Mechanism Efficiency**:
- Values cluster between 0.8-0.99, suggesting high system efficiency
- Section A contains most extreme values (0.783749-0.998722)
3. **Node Activation Patterns**:
- All sections maintain 3 active nodes (black)
- Section B has 2 inactivated nodes (red), others have 1
### Interpretation
The data suggests a relationship between network topology and interaction complexity. Section B's higher Φ value despite fewer connections implies that negative influences (red arrows) may amplify system complexity. The decreasing Φ values from A→B→C correlate with reduced negative influences and simplified topologies.
The mechanism cause-effect relationships show consistent high efficiency (0.8-0.99 range), but Section A's wider value distribution suggests greater variability in node interactions. The constant k=4 parameter across all sections indicates a fixed system constraint affecting these relationships.
Notably, the 3D graphs' geometric complexity mirrors the Φ values, with Section B's graph showing the most intricate structure. This visual representation supports the quantitative data, demonstrating how network configuration impacts system behavior.