# Roofline Model Analysis (Llama13B, A6000)
## Title
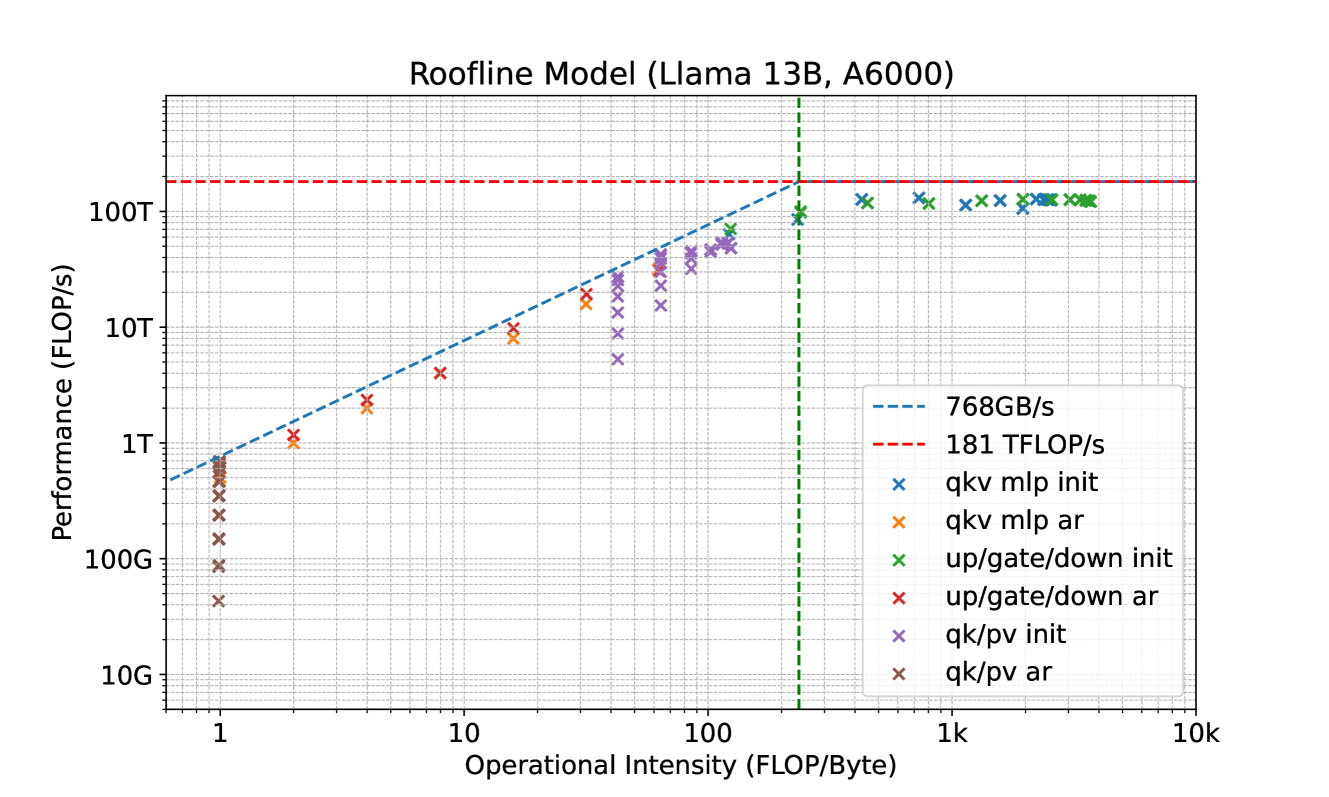
**Roofline Model (Llama 13B, A6000)**
## Axes
- **X-axis**: Operational Intensity (FLOP/Byte)
- Range: 1 to 10,000 (logarithmic scale)
- Key marker: Green dashed vertical line at **100 FLOP/Byte**
- **Y-axis**: Performance (FLOP/s)
- Range: 10G to 100T (logarithmic scale)
- Key markers:
- Red dashed horizontal line at **181 TFLOP/s**
- Blue dashed horizontal line at **768GB/s**
## Legend
| Symbol | Label | Color | Marker |
|--------|------------------------|--------|--------|
| Blue | 768GB/s | Dashed | N/A |
| Red | 181 TFLOP/s | Dashed | N/A |
| Blue | qkv mlp init | Cross | X |
| Orange | qkv mlp ar | Cross | X |
| Green | up/gate/down init | Cross | X |
| Red | up/gate/down ar | Cross | X |
| Purple | qk/pv init | Cross | X |
| Brown | qk/pv ar | Cross | X |
## Data Points
- **qkv mlp init** (Blue crosses):
- Clustered below 181 TFLOP/s line, increasing with operational intensity.
- **qkv mlp ar** (Orange crosses):
- Similar trend to qkv mlp init, slightly higher performance at mid-range intensities.
- **up/gate/down init** (Green crosses):
- Highest performance among non-ar operations, approaching 181 TFLOP/s at 100 FLOP/Byte.
- **up/gate/down ar** (Red crosses):
- Dominates performance above 100 FLOP/Byte, consistently near 181 TFLOP/s.
- **qk/pv init** (Purple crosses):
- Lower performance than qkv operations, plateauing below 10T FLOP/s.
- **qk/pv ar** (Brown crosses):
- Similar to qk/pv init, with minimal improvement at higher intensities.
## Key Trends
1. **Performance Ceiling**:
- The red dashed line (181 TFLOP/s) acts as a theoretical maximum for most operations.
- Only **up/gate/down ar** (red crosses) approaches this limit at high operational intensities (>100 FLOP/Byte).
2. **Memory Bandwidth Constraint**:
- The blue dashed line (768GB/s) represents memory bandwidth. Most data points fall below this line, indicating compute-bound operations.
3. **Operational Intensity Threshold**:
- The green dashed line at 100 FLOP/Byte marks a critical transition point.
- Above this threshold, **up/gate/down ar** achieves near-peak performance, while other operations plateau.
4. **Operation Efficiency**:
- **qkv mlp ar** and **up/gate/down ar** show the highest compute-to-memory efficiency.
- **qk/pv** operations (init/ar) are less efficient, remaining in the lower-left quadrant.
## Observations
- **Scalability**:
- Performance scales logarithmically with operational intensity for most operations.
- **Bottlenecks**:
- Memory-bound operations (e.g., qk/pv) are limited by bandwidth (768GB/s).
- Compute-bound operations (e.g., up/gate/down ar) hit the 181 TFLOP/s ceiling.