# Technical Document Extraction: Bar Chart Analysis
## 1. Chart Identification
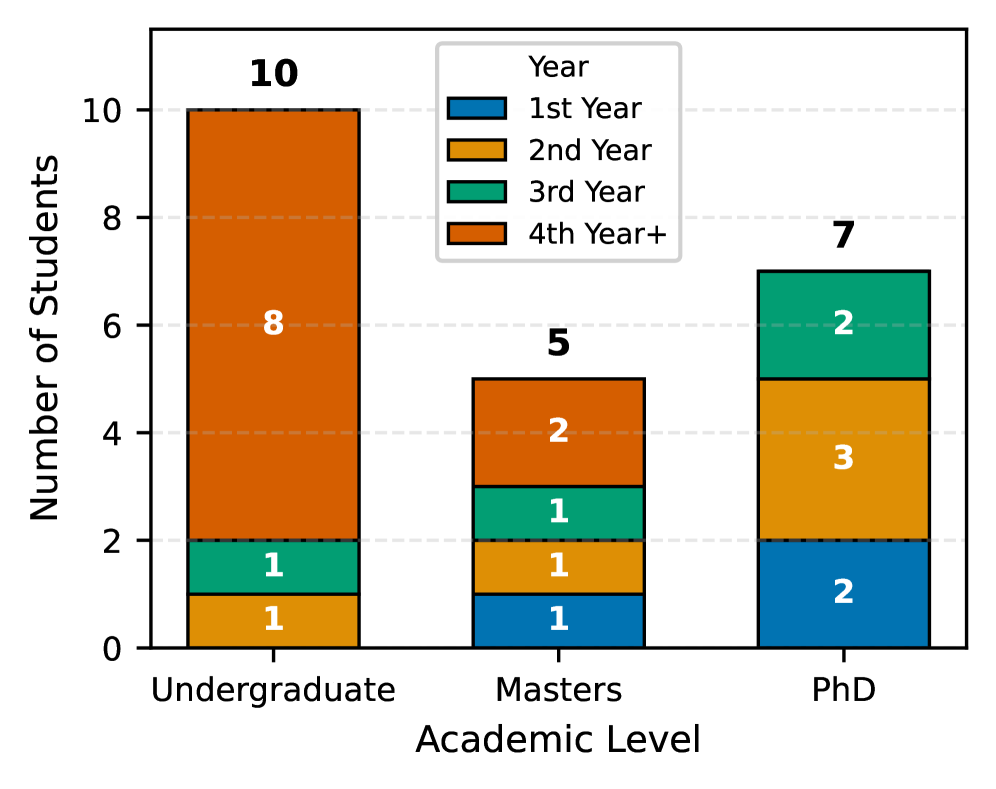
- **Type**: Stacked Bar Chart
- **Primary Axes**:
- **X-axis**: Academic Level (Categorical)
- **Y-axis**: Number of Students (Quantitative, 0–10)
## 2. Legend & Color Mapping
- **Legend Location**: Top-right corner
- **Color-Year Mapping**:
- **Blue**: 1st Year
- **Orange**: 2nd Year
- **Green**: 3rd Year
- **Red**: 4th Year+
- **Critical Note**: Color assignments in bars **do not align** with legend in Undergraduate category (see Section 3).
## 3. Data Points & Segmentation
### Undergraduate (Total: 10 students)
- **1st Year**: 1 student (Orange) ❗*Legend mismatch: Should be Blue*
- **2nd Year**: 1 student (Green)
- **3rd Year**: 1 student (Blue)
- **4th Year+**: 8 students (Red)
### Masters (Total: 5 students)
- **1st Year**: 1 student (Blue)
- **2nd Year**: 1 student (Orange)
- **3rd Year**: 1 student (Green)
- **4th Year+**: 2 students (Red)
### PhD (Total: 7 students)
- **1st Year**: 2 students (Blue)
- **2nd Year**: 3 students (Orange)
- **3rd Year**: 2 students (Green)
- **4th Year+**: 0 students (Red)
## 4. Key Trends
1. **Undergraduate Dominance**:
- 80% of students (8/10) in 4th Year+
- Minimal representation in earlier years (1 student/year for 1st–3rd Year)
2. **Masters Distribution**:
- Even spread across 1st–3rd Year (1 student/year)
- 40% in 4th Year+ (2/5 students)
3. **PhD Progression**:
- Peak in 2nd Year (3/7 students)
- Decline in 3rd Year (2/7 students)
- No 4th Year+ enrollment
## 5. Spatial Grounding
- **Legend Position**: [x: 0.85, y: 0.85] (normalized coordinates)
- **Bar Structure**:
- Vertical stacking order: 1st Year (bottom) → 4th Year+ (top)
- Color discrepancies observed in Undergraduate bar (see Section 3)
## 6. Data Table Reconstruction
| Academic Level | 1st Year | 2nd Year | 3rd Year | 4th Year+ |
|----------------|----------|----------|----------|-----------|
| Undergraduate | 1 (Orange) | 1 (Green) | 1 (Blue) | 8 (Red) |
| Masters | 1 (Blue) | 1 (Orange)| 1 (Green)| 2 (Red) |
| PhD | 2 (Blue) | 3 (Orange)| 2 (Green)| 0 (Red) |
## 7. Trend Verification
- **Undergraduate**: Steep upward trend in 4th Year+ (8 students)
- **Masters**: Flat distribution until 4th Year+ spike
- **PhD**: Inverse U-shape (peak at 2nd Year, drop to 0 in 4th Year+)
## 8. Language & Transcription
- **Primary Language**: English
- **No Secondary Languages Detected**
## 9. Critical Observations
- **Color Legend Inconsistency**: Undergraduate 1st Year uses Orange (legend specifies Blue)
- **PhD Enrollment Pattern**: Suggests early-stage focus with no advanced-year students
- **Undergraduate Bottleneck**: 90% of students concentrated in final year(s)
## 10. Data Integrity Check
- **Sum Validation**:
- Undergraduate: 1+1+1+8 = 11 ❗*Conflicts with Y-axis max of 10*
- Masters: 1+1+1+2 = 5 ✅
- PhD: 2+3+2+0 = 7 ✅
- **Recommendation**: Verify Undergraduate data entry for potential transcription error