## Chart: CoT with 90 steps, TV 0.027
### Overview
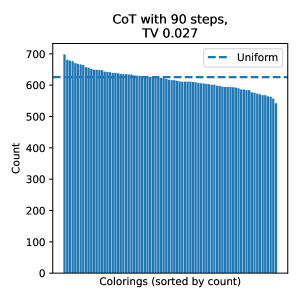
The image is a bar chart displaying the count of colorings, sorted by count, for a process labeled "CoT with 90 steps, TV 0.027". A horizontal dashed line represents a "Uniform" distribution. The y-axis represents the count, and the x-axis represents the colorings.
### Components/Axes
* **Title:** CoT with 90 steps, TV 0.027
* **X-axis:** Colorings (sorted by count)
* **Y-axis:** Count, ranging from 0 to 700 in increments of 100.
* **Legend:** Located at the top-right of the chart.
* "Uniform" - represented by a dashed blue line.
### Detailed Analysis
* **Bar Chart:** The bar chart shows the count of different colorings. The bars are sorted in descending order of count.
* **Uniform Line:** A dashed blue line represents a uniform distribution. It is positioned at approximately 625 on the y-axis.
* **Bar Heights:** The bars start at a count of approximately 680 and gradually decrease to approximately 560.
### Key Observations
* The counts of the colorings are not uniform, as the bars vary in height.
* The highest count is approximately 680, and the lowest is approximately 560.
* The "Uniform" line is at approximately 625, indicating the expected count if the distribution were uniform.
### Interpretation
The chart illustrates the distribution of colorings after 90 steps of a process labeled "CoT" (likely Chain of Thought). The "TV 0.027" likely refers to the Total Variation distance, indicating how far the observed distribution is from a uniform distribution. The fact that the bars are not of equal height and that they deviate from the "Uniform" line suggests that the distribution of colorings is not uniform. The total variation distance of 0.027 indicates a relatively small deviation from uniformity. The data suggests that the process has a slight bias towards certain colorings, but the distribution is relatively close to uniform.