\n
## Bar Chart: CoT with 90 steps, TV 0.027
### Overview
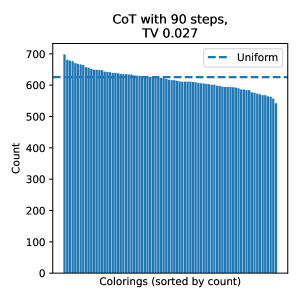
The image presents a bar chart visualizing the distribution of "Colorings" sorted by their "Count". A horizontal dashed line represents a "Uniform" distribution for comparison. The chart appears to show a relatively even distribution of colorings, with a slight downward trend in count as the colorings are sorted.
### Components/Axes
* **Title:** "CoT with 90 steps, TV 0.027" - Indicates the chart relates to a "Chain of Thought" process with 90 steps and a "Total Variation" (TV) of 0.027.
* **X-axis:** "Colorings (sorted by count)" - Represents the different colorings, ordered from most frequent to least frequent.
* **Y-axis:** "Count" - Represents the number of occurrences of each coloring. The scale ranges from 0 to approximately 700.
* **Legend:** Located in the top-right corner, it labels the dashed horizontal line as "Uniform". The line is colored blue.
### Detailed Analysis
The chart consists of a large number of vertical bars, each representing a different coloring. The bars are arranged horizontally, sorted by their count.
* **Trend:** The bars initially start with a count of approximately 680-690, then gradually decrease to a count of around 580-600. The decrease is not linear, but rather a slow, steady decline.
* **Uniform Line:** A horizontal dashed blue line is positioned at a count of approximately 620. This line represents the expected count for a uniform distribution.
* **Data Points (Approximate):**
* The first few bars have counts around 680-690.
* Around the 20th bar, the count is approximately 650.
* Around the 50th bar, the count is approximately 630.
* Around the 100th bar, the count is approximately 610.
* The last few bars have counts around 580-600.
### Key Observations
* The distribution of colorings is not perfectly uniform, as the counts generally decrease as the colorings are sorted.
* The counts are clustered around the "Uniform" level (approximately 620), suggesting that the distribution is relatively close to uniform.
* There are no significant outliers or unusual spikes in the data.
### Interpretation
The chart suggests that the "Chain of Thought" process with 90 steps and a TV of 0.027 results in a distribution of colorings that is reasonably close to a uniform distribution. The slight downward trend in counts indicates that some colorings are more likely than others, but the differences are not substantial. The TV value of 0.027 likely represents a measure of how far the actual distribution deviates from a perfectly uniform distribution. A lower TV value indicates a closer approximation to uniformity. The chart provides insight into the diversity of solutions or states explored during the CoT process. The fact that the distribution is relatively uniform suggests that the process is exploring a wide range of possibilities, rather than converging on a small set of solutions.