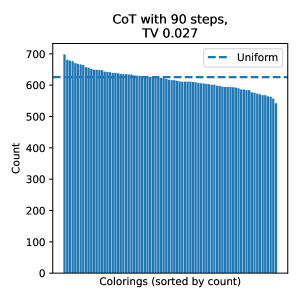
## Bar Chart with Reference Line: CoT with 90 steps, TV 0.027
### Overview
The image displays a bar chart titled "CoT with 90 steps, TV 0.027". It visualizes the frequency distribution ("Count") of various "Colorings," which are sorted in descending order by their count. A horizontal dashed line labeled "Uniform" serves as a reference, indicating the expected count if all colorings were equally probable. The chart suggests an analysis of the output distribution from a process (likely "Chain-of-Thought" with 90 steps), comparing it to a uniform baseline.
### Components/Axes
* **Chart Title:** "CoT with 90 steps, TV 0.027" (Top center).
* **Y-Axis:**
* **Label:** "Count" (Vertical, left side).
* **Scale:** Linear scale from 0 to 700, with major tick marks at 0, 100, 200, 300, 400, 500, 600, 700.
* **X-Axis:**
* **Label:** "Colorings (sorted by count)" (Horizontal, bottom).
* **Scale:** Categorical. Each bar represents a distinct "coloring." The specific labels for individual colorings are not visible; they are anonymized or aggregated into a sorted sequence.
* **Legend:**
* **Location:** Top-right corner of the plot area.
* **Entry:** A dashed blue line symbol followed by the text "Uniform".
* **Data Series:**
1. **Bars (Primary Data):** A series of vertical blue bars. Their height represents the observed count for each coloring.
2. **Dashed Line (Reference):** A horizontal, dashed blue line extending across the chart's width.
### Detailed Analysis
* **Bar Series Trend:** The bars are sorted from tallest on the left to shortest on the right, creating a clear, monotonically decreasing slope from left to right.
* **Bar Values (Approximate):**
* The tallest bar (far left) has a count of approximately **690-700**.
* The counts decrease gradually. The bar at the approximate midpoint has a count of roughly **625-630**.
* The shortest bar (far right) has a count of approximately **540-550**.
* **Uniform Reference Line:** The dashed "Uniform" line is positioned at a constant y-value of approximately **625**. This represents the expected count per coloring under a uniform distribution.
* **Spatial Relationship:** For the first ~60% of the colorings (from the left), the bar heights are **above** the uniform reference line. For the remaining ~40% (on the right), the bar heights fall **below** the uniform line.
### Key Observations
1. **Non-Uniform Distribution:** The distribution of counts across colorings is not uniform. There is a clear hierarchy, with some colorings being significantly more frequent than others.
2. **Skew:** The distribution is right-skewed (or positively skewed), with a longer tail of less frequent colorings on the right.
3. **Crossover Point:** The observed counts transition from being above the uniform expectation to below it. This crossover occurs slightly to the right of the chart's center.
4. **Magnitude of Deviation:** The most frequent coloring appears about **~12%** more often than the uniform expectation (700 vs. 625), while the least frequent coloring appears about **~14%** less often (540 vs. 625).
### Interpretation
This chart demonstrates that the process generating these "colorings" (CoT with 90 steps) does not produce all possible outcomes with equal probability. The "TV 0.027" in the title likely refers to the **Total Variation distance**, a statistical measure of how different two probability distributions are. A TV of 0.027 quantifies the deviation from uniformity observed visually.
The data suggests an underlying bias or structure in the generation process. Certain colorings are favored, appearing more frequently than a random, uniform process would predict, while others are suppressed. This could be due to constraints in the model's reasoning path (the "90 steps"), biases in the training data, or inherent properties of the coloring problem itself. The sorted presentation effectively highlights the inequality in frequency, making the deviation from the ideal "Uniform" benchmark immediately apparent. The chart is a diagnostic tool, revealing that the system's output distribution is skewed, which may be critical for understanding its behavior, reliability, or fairness.