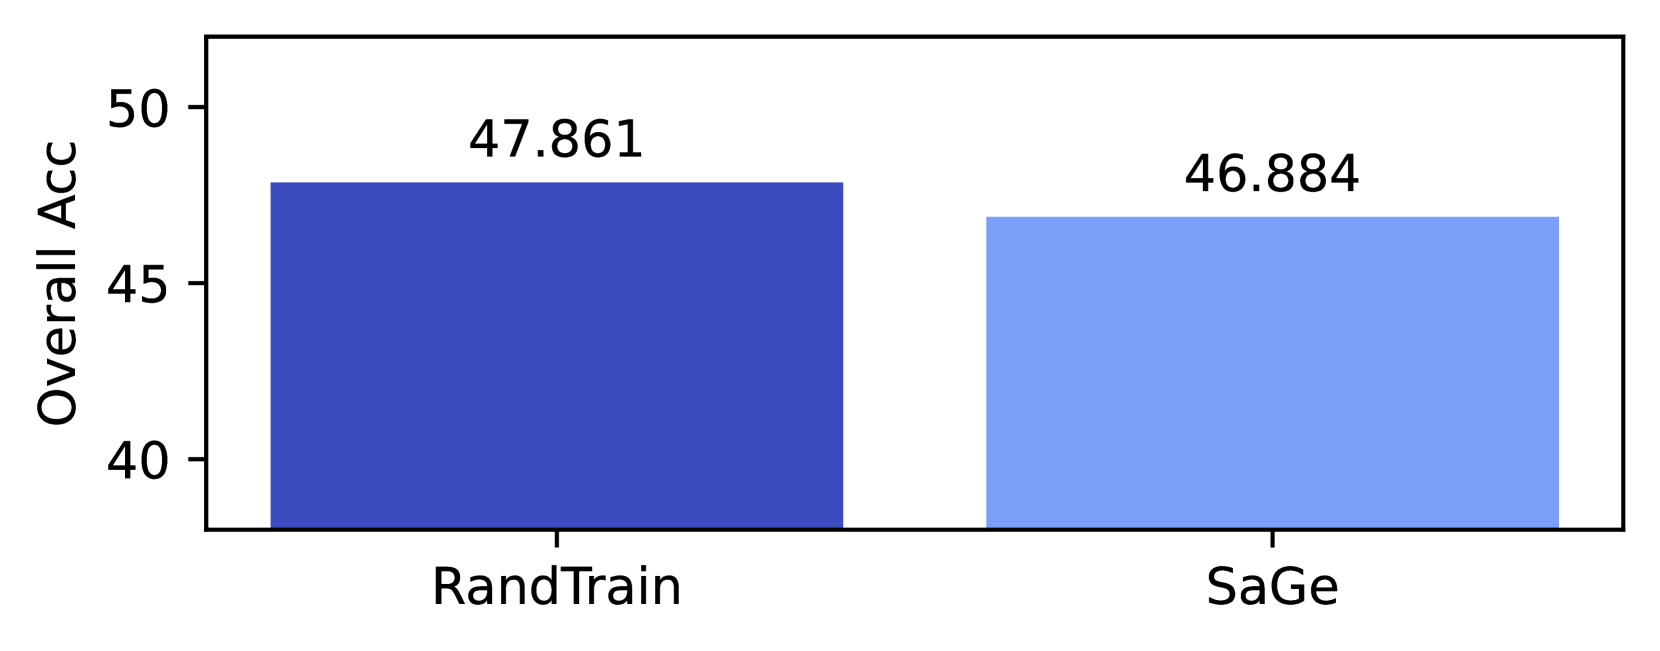
## Bar Chart: Overall Accuracy Comparison
### Overview
The image is a bar chart comparing the overall accuracy of two methods: "RandTrain" and "SaGe". The chart displays the accuracy values for each method using vertical bars.
### Components/Axes
* **Y-axis:** "Overall Acc" with scale markers at 40, 45, and 50.
* **X-axis:** Categorical axis with two categories: "RandTrain" and "SaGe".
* **Bars:**
* "RandTrain": Dark blue bar with a value of 47.861.
* "SaGe": Light blue bar with a value of 46.884.
### Detailed Analysis
* **RandTrain:** The dark blue bar representing "RandTrain" reaches a value of 47.861 on the Y-axis.
* **SaGe:** The light blue bar representing "SaGe" reaches a value of 46.884 on the Y-axis.
### Key Observations
* "RandTrain" has a slightly higher overall accuracy compared to "SaGe".
* The difference in accuracy between the two methods is approximately 1 percentage point.
### Interpretation
The bar chart suggests that the "RandTrain" method performs marginally better in terms of overall accuracy compared to the "SaGe" method. The difference, however, is relatively small, indicating that both methods achieve similar levels of accuracy.