## Image Grid: M(RT)^2 vs. RBM at Varying Temperatures
### Overview
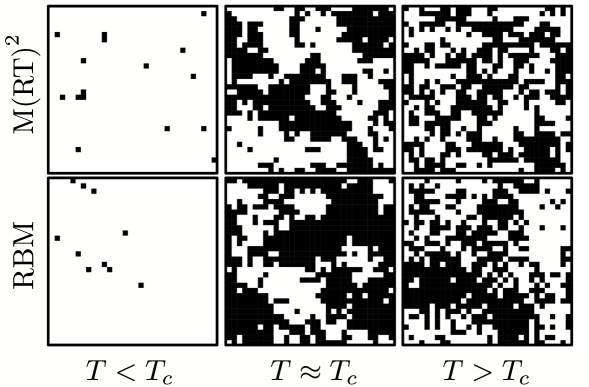
The image presents a 2x3 grid of plots. The top row represents data for "M(RT)^2", and the bottom row represents data for "RBM". The columns represent different temperature regimes: T < Tc, T ≈ Tc, and T > Tc, where Tc is a critical temperature. Each plot displays a binary pattern of black and white pixels, visually representing the state of the system under the specified conditions.
### Components/Axes
* **Rows:**
* Row 1: M(RT)^2
* Row 2: RBM
* **Columns (Temperature Regimes):**
* Column 1: T < Tc (Temperature less than critical temperature)
* Column 2: T ≈ Tc (Temperature approximately equal to critical temperature)
* Column 3: T > Tc (Temperature greater than critical temperature)
* **Pixel Representation:**
* Black pixels: Represent one state (e.g., spin up)
* White pixels: Represent another state (e.g., spin down)
### Detailed Analysis
**Row 1: M(RT)^2**
* **T < Tc:** The plot shows a predominantly white background with a sparse scattering of black pixels. The black pixels appear randomly distributed.
* **T ≈ Tc:** The plot shows a mix of black and white regions. The regions are larger and more interconnected than in the T < Tc case. There are large clusters of black and white pixels.
* **T > Tc:** The plot shows a more even distribution of black and white pixels, with smaller, more fragmented regions compared to T ≈ Tc. The black and white pixels are more evenly mixed.
**Row 2: RBM**
* **T < Tc:** Similar to the M(RT)^2 case, this plot shows a predominantly white background with a sparse scattering of black pixels.
* **T ≈ Tc:** The plot shows a mix of black and white regions, similar to the M(RT)^2 case, but the regions might be slightly smaller or more fragmented.
* **T > Tc:** The plot shows a more even distribution of black and white pixels, similar to the M(RT)^2 case, with smaller, more fragmented regions compared to T ≈ Tc.
### Key Observations
* At T < Tc, both M(RT)^2 and RBM show a state dominated by one color (white), indicating a more ordered phase.
* As the temperature approaches Tc (T ≈ Tc), both M(RT)^2 and RBM exhibit larger, interconnected regions of both colors, suggesting the emergence of phase coexistence or critical fluctuations.
* At T > Tc, both M(RT)^2 and RBM show a more disordered state with a more even distribution of black and white pixels, indicating a transition to a different phase.
### Interpretation
The image visually represents the behavior of two systems, M(RT)^2 and RBM, as they transition through a critical temperature (Tc). The plots suggest that both systems undergo a phase transition from an ordered state (T < Tc) to a disordered state (T > Tc), with a critical region (T ≈ Tc) characterized by large fluctuations and phase coexistence. The similarity in the patterns between M(RT)^2 and RBM suggests that they may exhibit similar critical behavior or belong to the same universality class. The visual representation allows for a qualitative understanding of the system's behavior as a function of temperature.