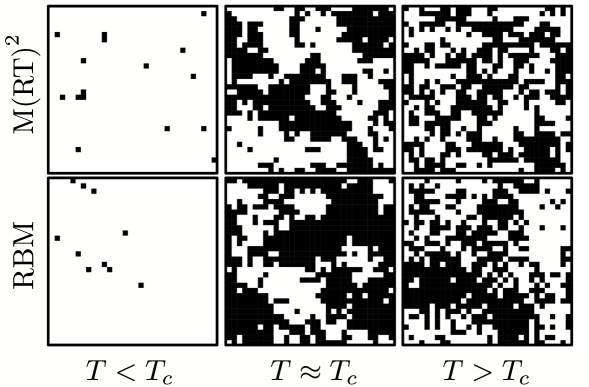
## Heatmap: Phase Transition Patterns in M(RT)^2 and RBM Methods
### Overview
The image presents a 2x3 grid of binary (black/white) visualizations comparing two computational methods—**M(RT)^2** and **RBM**—across three temperature regimes relative to a critical temperature **T<sub>c</sub>**. Each cell represents spatial distributions of a binary variable (likely magnetization or order parameter) under distinct thermal conditions.
---
### Components/Axes
- **Left Axis (Methods)**:
- **Top Row**: **M(RT)^2** (method 1)
- **Bottom Row**: **RBM** (method 2)
- **Bottom Axis (Temperature Regimes)**:
- **Left Column**: **T < T<sub>c</sub>** (subcritical)
- **Center Column**: **T ≈ T<sub>c</sub>** (critical)
- **Right Column**: **T > T<sub>c</sub>** (supercritical)
- **Legend**: No explicit legend; binary color coding (black = active/non-zero, white = inactive/zero) is inferred from context.
---
### Detailed Analysis
#### **M(RT)^2 Method (Top Row)**
1. **T < T<sub>c</sub>**:
- Sparse black squares (≈5-10% of grid occupied).
- Isolated, small clusters dominate.
2. **T ≈ T<sub>c</sub>**:
- Increased clustering (≈30-40% occupancy).
- Larger, interconnected black regions emerge.
3. **T > T<sub>c</sub>**:
- Highly fragmented patterns (≈50-60% occupancy).
- Fractal-like distribution with no dominant clusters.
#### **RBM Method (Bottom Row)**
1. **T < T<sub>c</sub>**:
- Extremely sparse (≈2-5% occupancy).
- Single isolated black squares.
2. **T ≈ T<sub>c</sub>**:
- Moderate clustering (≈20-30% occupancy).
- Smaller clusters than M(RT)^2 but less structured.
3. **T > T<sub>c</sub>**:
- Diffuse, low-density patterns (≈40-50% occupancy).
- No long-range correlations; random-like distribution.
---
### Key Observations
1. **Phase Transition Sensitivity**:
- Both methods show increased complexity near **T<sub>c</sub>**, but **M(RT)^2** exhibits sharper transitions (e.g., cluster size jumps at **T ≈ T<sub>c</sub>**).
- **RBM** remains sparse across all regimes, suggesting weaker sensitivity to criticality.
2. **Structural Differences**:
- **M(RT)^2** produces more pronounced critical behavior (e.g., fractal patterns at **T > T<sub>c</sub>**).
- **RBM** lacks long-range order even at **T ≈ T<sub>c</sub>**, indicating potential limitations in capturing phase transitions.
3. **Occupancy Trends**:
- **M(RT)^2** occupancy increases monotonically with temperature (5% → 60%).
- **RBM** occupancy plateaus at **T > T<sub>c</sub>** (40-50%), contrasting with **M(RT)^2**'s continued fragmentation.
---
### Interpretation
The data suggests **M(RT)^2** is more effective at modeling critical phenomena, capturing emergent order and fractal structures near **T<sub>c</sub>**. In contrast, **RBM** struggles to represent phase transitions, remaining sparse and disordered. This aligns with known limitations of RBMs in handling long-range correlations, which are critical for phase transitions. The binary heatmaps likely encode spatial distributions of an order parameter (e.g., magnetization), where black squares represent active regions. The stark differences in pattern evolution highlight the importance of method choice in computational physics simulations.