## Chart Type: Line Graphs Comparing Training and Testing Accuracy
### Overview
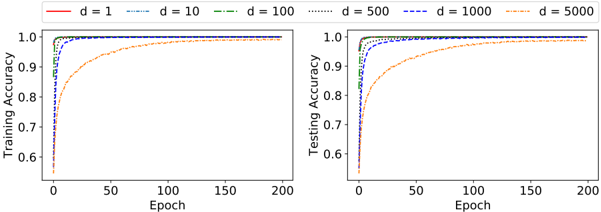
The image contains two line graphs side-by-side. The left graph displays "Training Accuracy" versus "Epoch," while the right graph displays "Testing Accuracy" versus "Epoch." Both graphs show the performance of a model with varying values of 'd' (likely a hyperparameter). The x-axis (Epoch) ranges from 0 to 200 in both graphs. The y-axis (Accuracy) ranges from 0.6 to 1.0 in both graphs. The legend, located at the top, indicates the line colors corresponding to different 'd' values: d=1 (red), d=10 (blue, dashed), d=100 (green, dash-dot), d=500 (black, dotted), d=1000 (blue, dash-dot-dot), and d=5000 (orange, dash-dot).
### Components/Axes
* **X-axis (both graphs):** Epoch, ranging from 0 to 200. Major ticks at 0, 50, 100, 150, and 200.
* **Y-axis (both graphs):** Accuracy, ranging from 0.6 to 1.0. Major ticks at 0.6, 0.7, 0.8, 0.9, and 1.0.
* **Left Graph Title:** Training Accuracy
* **Right Graph Title:** Testing Accuracy
* **Legend (Top):**
* d = 1 (red, solid line)
* d = 10 (blue, dashed line)
* d = 100 (green, dash-dot line)
* d = 500 (black, dotted line)
* d = 1000 (blue, dash-dot-dot line)
* d = 5000 (orange, dash-dot line)
### Detailed Analysis
**Left Graph: Training Accuracy**
* **d = 1 (red, solid line):** Starts at approximately 0.6 and rapidly increases to approximately 0.95 by epoch 20, then slowly increases to 1.0.
* **d = 10 (blue, dashed line):** Starts at approximately 0.6 and rapidly increases to approximately 0.98 by epoch 20, then slowly increases to 1.0.
* **d = 100 (green, dash-dot line):** Starts at approximately 0.75 and rapidly increases to approximately 0.99 by epoch 10, then slowly increases to 1.0.
* **d = 500 (black, dotted line):** Starts at approximately 0.7 and rapidly increases to approximately 0.99 by epoch 10, then slowly increases to 1.0.
* **d = 1000 (blue, dash-dot-dot line):** Starts at approximately 0.7 and rapidly increases to approximately 0.99 by epoch 10, then slowly increases to 1.0.
* **d = 5000 (orange, dash-dot line):** Starts at approximately 0.6 and gradually increases to approximately 0.99 by epoch 100, then slowly increases to 1.0.
**Right Graph: Testing Accuracy**
* **d = 1 (red, solid line):** Starts at approximately 0.6 and rapidly increases to approximately 0.95 by epoch 20, then slowly increases to 1.0.
* **d = 10 (blue, dashed line):** Starts at approximately 0.6 and rapidly increases to approximately 0.98 by epoch 20, then slowly increases to 1.0.
* **d = 100 (green, dash-dot line):** Starts at approximately 0.75 and rapidly increases to approximately 0.99 by epoch 10, then slowly increases to 1.0.
* **d = 500 (black, dotted line):** Starts at approximately 0.7 and rapidly increases to approximately 0.99 by epoch 10, then slowly increases to 1.0.
* **d = 1000 (blue, dash-dot-dot line):** Starts at approximately 0.7 and rapidly increases to approximately 0.99 by epoch 10, then slowly increases to 1.0.
* **d = 5000 (orange, dash-dot line):** Starts at approximately 0.6 and gradually increases to approximately 0.99 by epoch 100, then slowly increases to 1.0.
### Key Observations
* For both training and testing accuracy, higher values of 'd' (100, 500, 1000) generally lead to faster initial increases in accuracy.
* The 'd = 5000' line (orange) shows a slower increase in accuracy compared to other 'd' values.
* All lines converge to approximately 1.0 accuracy as the number of epochs increases.
* The training and testing accuracy graphs are very similar, suggesting the model is not overfitting significantly.
### Interpretation
The graphs illustrate the impact of the hyperparameter 'd' on the training and testing accuracy of a model. The data suggests that increasing 'd' up to a certain point (around 100-1000) can improve the initial learning rate, leading to faster convergence. However, excessively large values of 'd' (e.g., 5000) may slow down the learning process. The similarity between training and testing accuracy indicates that the model generalizes well to unseen data and is not memorizing the training set. The optimal value of 'd' would likely be in the range of 100-1000, balancing fast convergence with good generalization.