\n
## Line Charts: Training and Testing Accuracy vs. Epoch for Different Model Dimensions (d)
### Overview
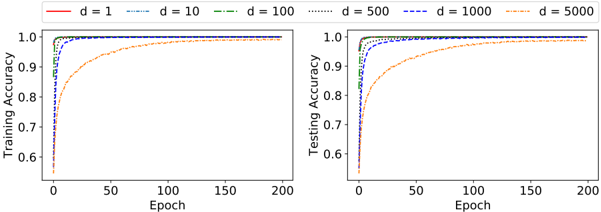
The image contains two side-by-side line charts comparing the training and testing accuracy of a machine learning model over 200 training epochs. The comparison is made across six different model dimensions, denoted by `d`. The charts illustrate how model dimensionality affects both learning speed (convergence) and final performance.
### Components/Axes
* **Chart Layout:** Two separate plots arranged horizontally.
* **Left Plot Title (Y-axis label):** `Training Accuracy`
* **Right Plot Title (Y-axis label):** `Testing Accuracy`
* **Common X-axis Label (for both plots):** `Epoch`
* **X-axis Scale:** Linear scale from 0 to 200, with major tick marks at 0, 50, 100, 150, and 200.
* **Y-axis Scale (for both plots):** Linear scale from 0.6 to 1.0, with major tick marks at 0.6, 0.7, 0.8, 0.9, and 1.0.
* **Legend:** Positioned at the top center, spanning both charts. It defines six data series by line color and style:
* `d = 1`: Solid red line.
* `d = 10`: Blue dash-dot line (`-·-`).
* `d = 100`: Green dashed line (`--`).
* `d = 500`: Gray dotted line (`...`).
* `d = 1000`: Blue dashed line (`--`). *Note: This is a different blue and style from d=10.*
* `d = 5000`: Orange dash-dot-dot line (`-··-`).
### Detailed Analysis
**Trend Verification & Data Point Extraction (Approximate Values):**
**Left Chart: Training Accuracy**
* **General Trend:** All six lines show a steep, near-vertical increase in accuracy from epoch 0, followed by a rapid plateau near 1.0. The primary difference is the speed of initial convergence.
* **d = 1 (Red, Solid):** Starts at ~0.60. Reaches >0.99 by epoch ~10. Plateaus at ~1.00.
* **d = 10 (Blue, Dash-Dot):** Starts at ~0.60. Reaches >0.99 by epoch ~15. Plateaus at ~1.00.
* **d = 100 (Green, Dashed):** Starts at ~0.60. Reaches >0.99 by epoch ~20. Plateaus at ~1.00.
* **d = 500 (Gray, Dotted):** Starts at ~0.60. Reaches >0.99 by epoch ~25. Plateaus at ~1.00.
* **d = 1000 (Blue, Dashed):** Starts at ~0.60. Reaches >0.99 by epoch ~30. Plateaus at ~1.00.
* **d = 5000 (Orange, Dash-Dot-Dot):** Starts lower at ~0.55. Shows a noticeably slower, curved ascent. Reaches ~0.95 by epoch ~50, ~0.99 by epoch ~100, and approaches ~1.00 by epoch 200.
**Right Chart: Testing Accuracy**
* **General Trend:** Similar initial steep increase for all lines, but with more separation and slightly lower final values compared to training accuracy, indicating potential overfitting. The `d=5000` line again shows the slowest convergence.
* **d = 1 (Red, Solid):** Starts at ~0.60. Rises sharply to ~0.98 by epoch ~20. Plateaus at ~0.99.
* **d = 10 (Blue, Dash-Dot):** Starts at ~0.60. Rises sharply to ~0.98 by epoch ~25. Plateaus at ~0.99.
* **d = 100 (Green, Dashed):** Starts at ~0.60. Rises to ~0.97 by epoch ~30. Plateaus at ~0.98-0.99.
* **d = 500 (Gray, Dotted):** Starts at ~0.60. Rises to ~0.96 by epoch ~40. Plateaus at ~0.98.
* **d = 1000 (Blue, Dashed):** Starts at ~0.60. Rises to ~0.95 by epoch ~50. Plateaus at ~0.97-0.98.
* **d = 5000 (Orange, Dash-Dot-Dot):** Starts lowest at ~0.55. Slow, curved ascent. Reaches ~0.90 by epoch ~50, ~0.96 by epoch ~100, and approaches ~0.98 by epoch 200.
### Key Observations
1. **Convergence Speed vs. Dimension:** There is a clear inverse relationship between model dimension (`d`) and the speed of convergence. Lower `d` values (1, 10) achieve near-maximum accuracy within the first 10-20 epochs. The highest dimension (`d=5000`) requires nearly the full 200 epochs to approach the same level.
2. **Final Performance Gap:** While all models eventually reach high accuracy, a small but consistent gap exists between training and testing accuracy for each `d`. This gap widens slightly as `d` increases (e.g., `d=1000` plateaus at ~1.00 training vs. ~0.975 testing), suggesting increased overfitting with model complexity.
3. **Initial Condition:** All models start at a similar baseline accuracy (~0.60) at epoch 0, except for `d=5000`, which starts lower (~0.55). This could indicate initialization effects or the difficulty of evaluating a very high-dimensional model before any training.
4. **Visual Distinction:** The line styles and colors are effectively used to distinguish the six series, though the two blue lines (`d=10` and `d=1000`) require careful attention to their different dash patterns.
### Interpretation
This data demonstrates the classic trade-off between model capacity (represented by dimension `d`) and optimization dynamics. A higher-dimensional model (`d=5000`) has greater representational power but faces a more complex loss landscape, resulting in slower gradient-based optimization (slower convergence). Conversely, low-dimensional models (`d=1`) optimize very quickly but may have a lower capacity ceiling, though in this specific task, they appear to reach near-perfect performance.
The persistent gap between training and testing accuracy across all models indicates that the task has some inherent noise or that all models are slightly overfitting. The fact that this gap is largest for the highest `d` values aligns with the principle that overly complex models are more prone to fitting noise in the training data.
**Peircean Insight:** The charts are an *icon* of the learning process, visually representing the relationship between time (epochs), performance (accuracy), and model complexity (`d`). They are also an *index* of optimization difficulty—the slower rise of the `d=5000` line is a direct effect of the challenges in navigating a high-dimensional parameter space. The data suggests that for this particular problem, increasing model dimension beyond a certain point (`d=100` or `d=500`) yields diminishing returns in final accuracy while incurring a significant cost in training time. The optimal choice of `d` would balance the need for fast training against the requirement for maximum generalization performance.