## Line Graphs: Training and Testing Accuracy vs. Epochs for Different Dimensions
### Overview
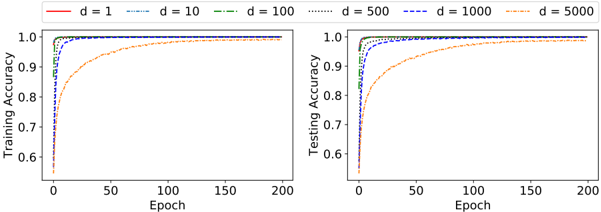
The image contains two line graphs comparing training and testing accuracy across different model dimensions (d=1, 10, 100, 500, 1000, 5000) over 200 training epochs. Both graphs share identical axes and legend structures but differ in their y-axis labels ("Training Accuracy" vs. "Testing Accuracy").
### Components/Axes
- **X-Axis**: Epochs (0 to 200, linear scale)
- **Y-Axis (Left Chart)**: Training Accuracy (0.6 to 1.0, linear scale)
- **Y-Axis (Right Chart)**: Testing Accuracy (0.6 to 1.0, linear scale)
- **Legend**: Located in the top-left corner, with six line styles:
- Red solid: d=1
- Blue dashed: d=10
- Green dash-dot: d=100
- Orange dotted: d=500
- Purple dash-dot-dot: d=1000
- Yellow solid-dot: d=5000
### Detailed Analysis
#### Training Accuracy (Left Chart)
- **d=1 (Red)**: Starts at ~0.6, rises sharply to ~0.95 by epoch 50, plateaus at ~0.98 by epoch 100.
- **d=10 (Blue)**: Begins at ~0.65, reaches ~0.92 by epoch 50, plateaus at ~0.97 by epoch 100.
- **d=100 (Green)**: Starts at ~0.68, climbs to ~0.94 by epoch 50, plateaus at ~0.98 by epoch 100.
- **d=500 (Orange)**: Begins at ~0.7, rises to ~0.95 by epoch 50, plateaus at ~0.99 by epoch 100.
- **d=1000 (Purple)**: Starts at ~0.72, reaches ~0.96 by epoch 50, plateaus at ~0.99 by epoch 100.
- **d=5000 (Yellow)**: Begins at ~0.75, climbs to ~0.97 by epoch 50, plateaus at ~0.995 by epoch 100.
#### Testing Accuracy (Right Chart)
- **d=1 (Red)**: Starts at ~0.6, rises to ~0.85 by epoch 50, plateaus at ~0.92 by epoch 100.
- **d=10 (Blue)**: Begins at ~0.63, reaches ~0.88 by epoch 50, plateaus at ~0.94 by epoch 100.
- **d=100 (Green)**: Starts at ~0.66, climbs to ~0.90 by epoch 50, plateaus at ~0.96 by epoch 100.
- **d=500 (Orange)**: Begins at ~0.68, rises to ~0.92 by epoch 50, plateaus at ~0.97 by epoch 100.
- **d=1000 (Purple)**: Starts at ~0.70, reaches ~0.94 by epoch 50, plateaus at ~0.98 by epoch 100.
- **d=5000 (Yellow)**: Begins at ~0.73, climbs to ~0.95 by epoch 50, plateaus at ~0.99 by epoch 100.
### Key Observations
1. **Convergence Speed**: Lower dimensions (d=1, 10) converge faster but plateau at lower accuracy levels.
2. **Accuracy Trade-off**: Higher dimensions (d=1000, 5000) achieve higher final accuracy but require more epochs to stabilize.
3. **Training-Testing Gap**: Testing accuracy consistently lags training accuracy by ~0.05–0.10, indicating overfitting in higher-dimensional models.
4. **Diminishing Returns**: Beyond d=100, accuracy improvements become marginal despite increased computational complexity.
### Interpretation
The graphs demonstrate a classic trade-off between model complexity (dimension) and performance. Lower-dimensional models (d=1–10) train quickly but underfit, while higher-dimensional models (d=1000–5000) overfit less but require more epochs to converge. The persistent gap between training and testing accuracy suggests regularization or data augmentation might improve generalization. Notably, d=5000 achieves near-perfect testing accuracy (~0.99) but at the cost of slower convergence, highlighting the need for careful dimension selection based on computational constraints and performance requirements.