## Line Chart: Number of Fixed Packages vs. Year of Unreproducibility Introduction
### Overview
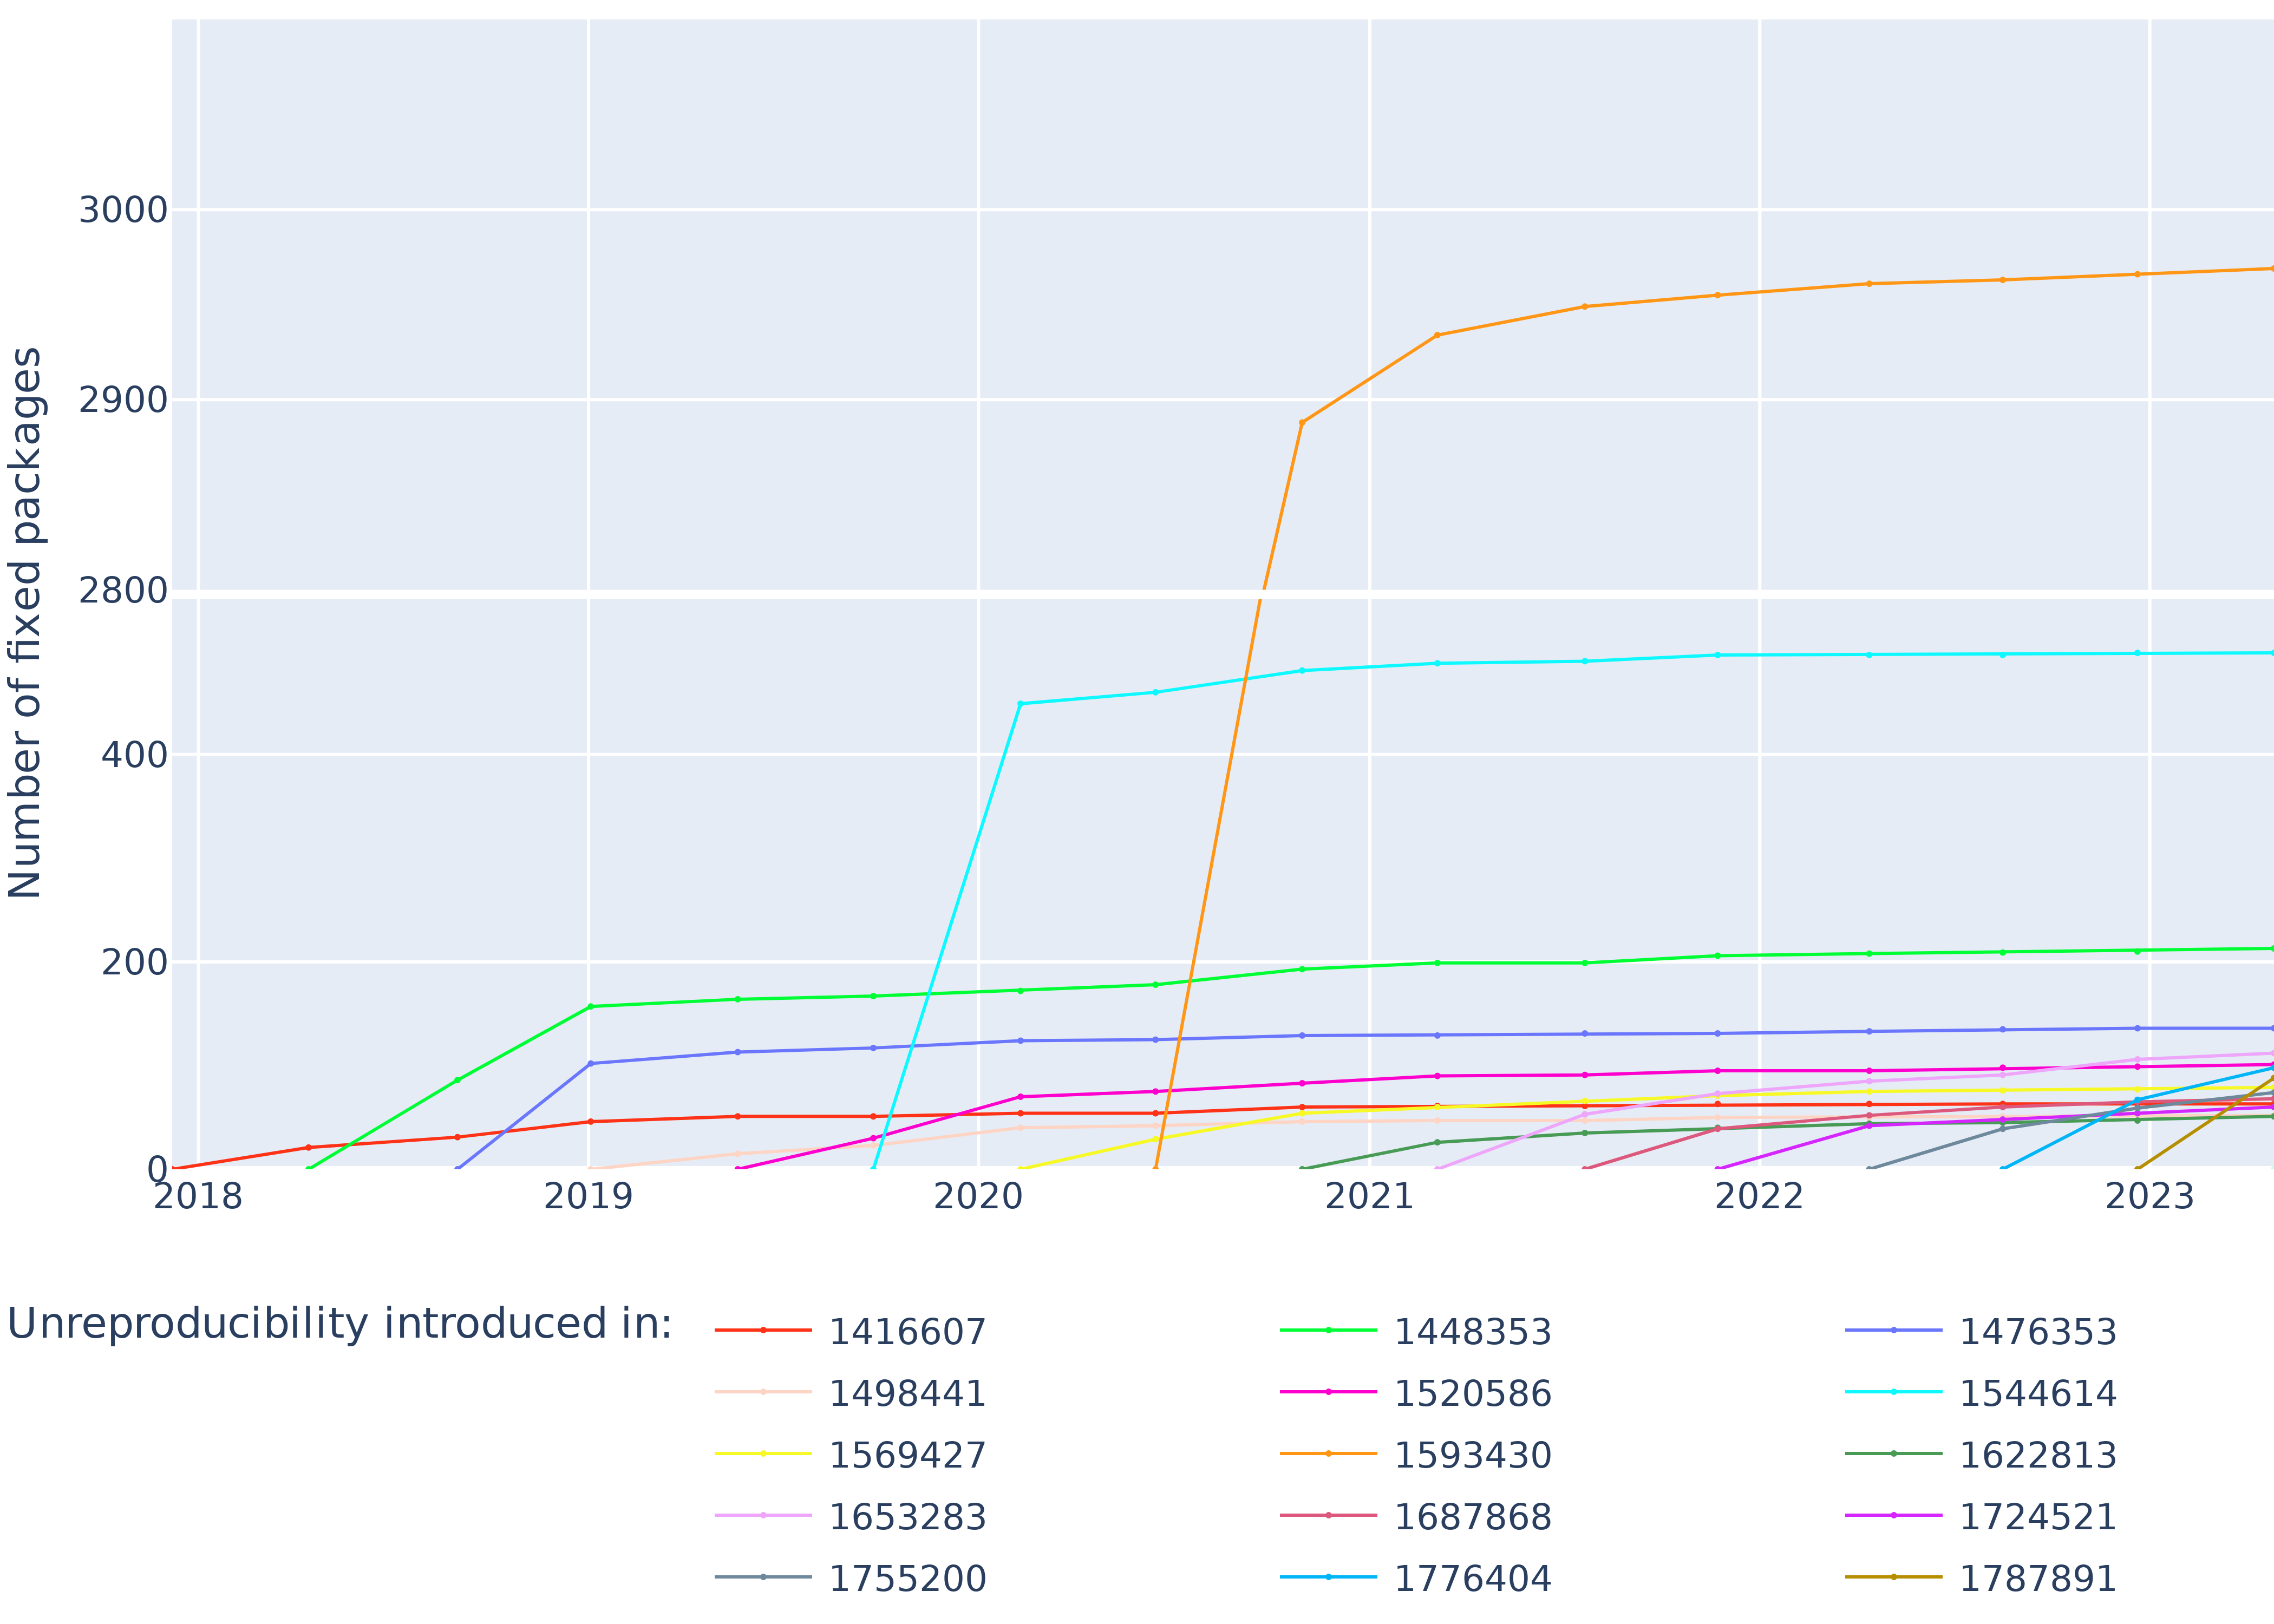
The image is a line chart showing the number of fixed packages over time (from 2018 to 2023) for different categories of packages, grouped by the year in which unreproducibility was introduced. Each line represents a different year of unreproducibility introduction, and the y-axis represents the number of fixed packages.
### Components/Axes
* **Title (Y-Axis):** "Number of fixed packages"
* **Scale (Y-Axis):** 0, 200, 400, 2800, 2900, 3000
* **Title (X-Axis):** The x-axis is implicitly "Year".
* **Scale (X-Axis):** 2018, 2019, 2020, 2021, 2022, 2023
* **Legend:** Located at the bottom of the chart, labeled "Unreproducibility introduced in:". The legend lists the years of unreproducibility introduction, each associated with a specific color.
* 1416607 (Brown)
* 1498441 (Light Pink)
* 1569427 (Yellow)
* 1653283 (Light Purple)
* 1755200 (Dark Gray)
* 1448353 (Green)
* 1520586 (Magenta)
* 1593430 (Orange)
* 1687868 (Dark Red)
* 1776404 (Cyan)
* 1476353 (Blue)
* 1544614 (Light Blue)
* 1622813 (Dark Green)
* 1724521 (Dark Purple)
* 1787891 (Olive)
### Detailed Analysis
* **Brown Line (1416607):** Starts at approximately 10 in 2018, increases to approximately 30 in 2023.
* **Light Pink Line (1498441):** Starts at approximately 0 in 2018, increases to approximately 40 in 2023.
* **Yellow Line (1569427):** Starts at approximately 0 in 2018, increases to approximately 50 in 2023.
* **Light Purple Line (1653283):** Starts at approximately 0 in 2018, increases to approximately 60 in 2023.
* **Dark Gray Line (1755200):** Starts at approximately 0 in 2018, increases to approximately 70 in 2023.
* **Green Line (1448353):** Starts at approximately 10 in 2018, increases sharply to approximately 150 in 2019, and then increases gradually to approximately 210 in 2023.
* **Magenta Line (1520586):** Starts at approximately 0 in 2018, increases to approximately 80 in 2023.
* **Orange Line (1593430):** Starts at approximately 0 in 2018, increases sharply to approximately 2700 in 2021, and then increases gradually to approximately 2900 in 2023.
* **Dark Red Line (1687868):** Starts at approximately 0 in 2018, increases to approximately 40 in 2023.
* **Cyan Line (1776404):** Starts at approximately 0 in 2018, increases sharply to approximately 2700 in 2020, and then remains relatively constant at approximately 2700 in 2023.
* **Blue Line (1476353):** Starts at approximately 0 in 2018, increases to approximately 140 in 2019, and then increases gradually to approximately 150 in 2023.
* **Light Blue Line (1544614):** Starts at approximately 0 in 2018, increases sharply to approximately 400 in 2020, and then remains relatively constant at approximately 400 in 2023.
* **Dark Green Line (1622813):** Starts at approximately 0 in 2018, increases to approximately 220 in 2023.
* **Dark Purple Line (1724521):** Starts at approximately 0 in 2018, increases to approximately 80 in 2023.
* **Olive Line (1787891):** Starts at approximately 0 in 2018, increases to approximately 40 in 2023.
### Key Observations
* The orange line (1593430) shows the most significant increase in the number of fixed packages, followed by the cyan line (1776404).
* Most lines show a gradual increase in the number of fixed packages over time.
* The cyan line (1776404) and orange line (1593430) show a sharp increase in the number of fixed packages around 2020 and 2021, respectively, and then plateau.
* The other lines show a much smaller increase in the number of fixed packages.
### Interpretation
The chart illustrates the progress in fixing packages that were initially introduced with unreproducibility in different years. The orange line (1593430) and cyan line (1776404) indicate that packages with unreproducibility introduced in those years have seen the most significant fixing efforts. The plateauing of these lines suggests that the majority of fixable packages from those years have already been addressed. The other lines, with their gradual increases, indicate ongoing efforts to fix packages with unreproducibility introduced in those years, but at a slower pace. The data suggests that the focus of fixing efforts may have shifted over time, or that some types of unreproducibility are more easily addressed than others.