## Line Chart: Number of Fixed Packages Over Time
### Overview
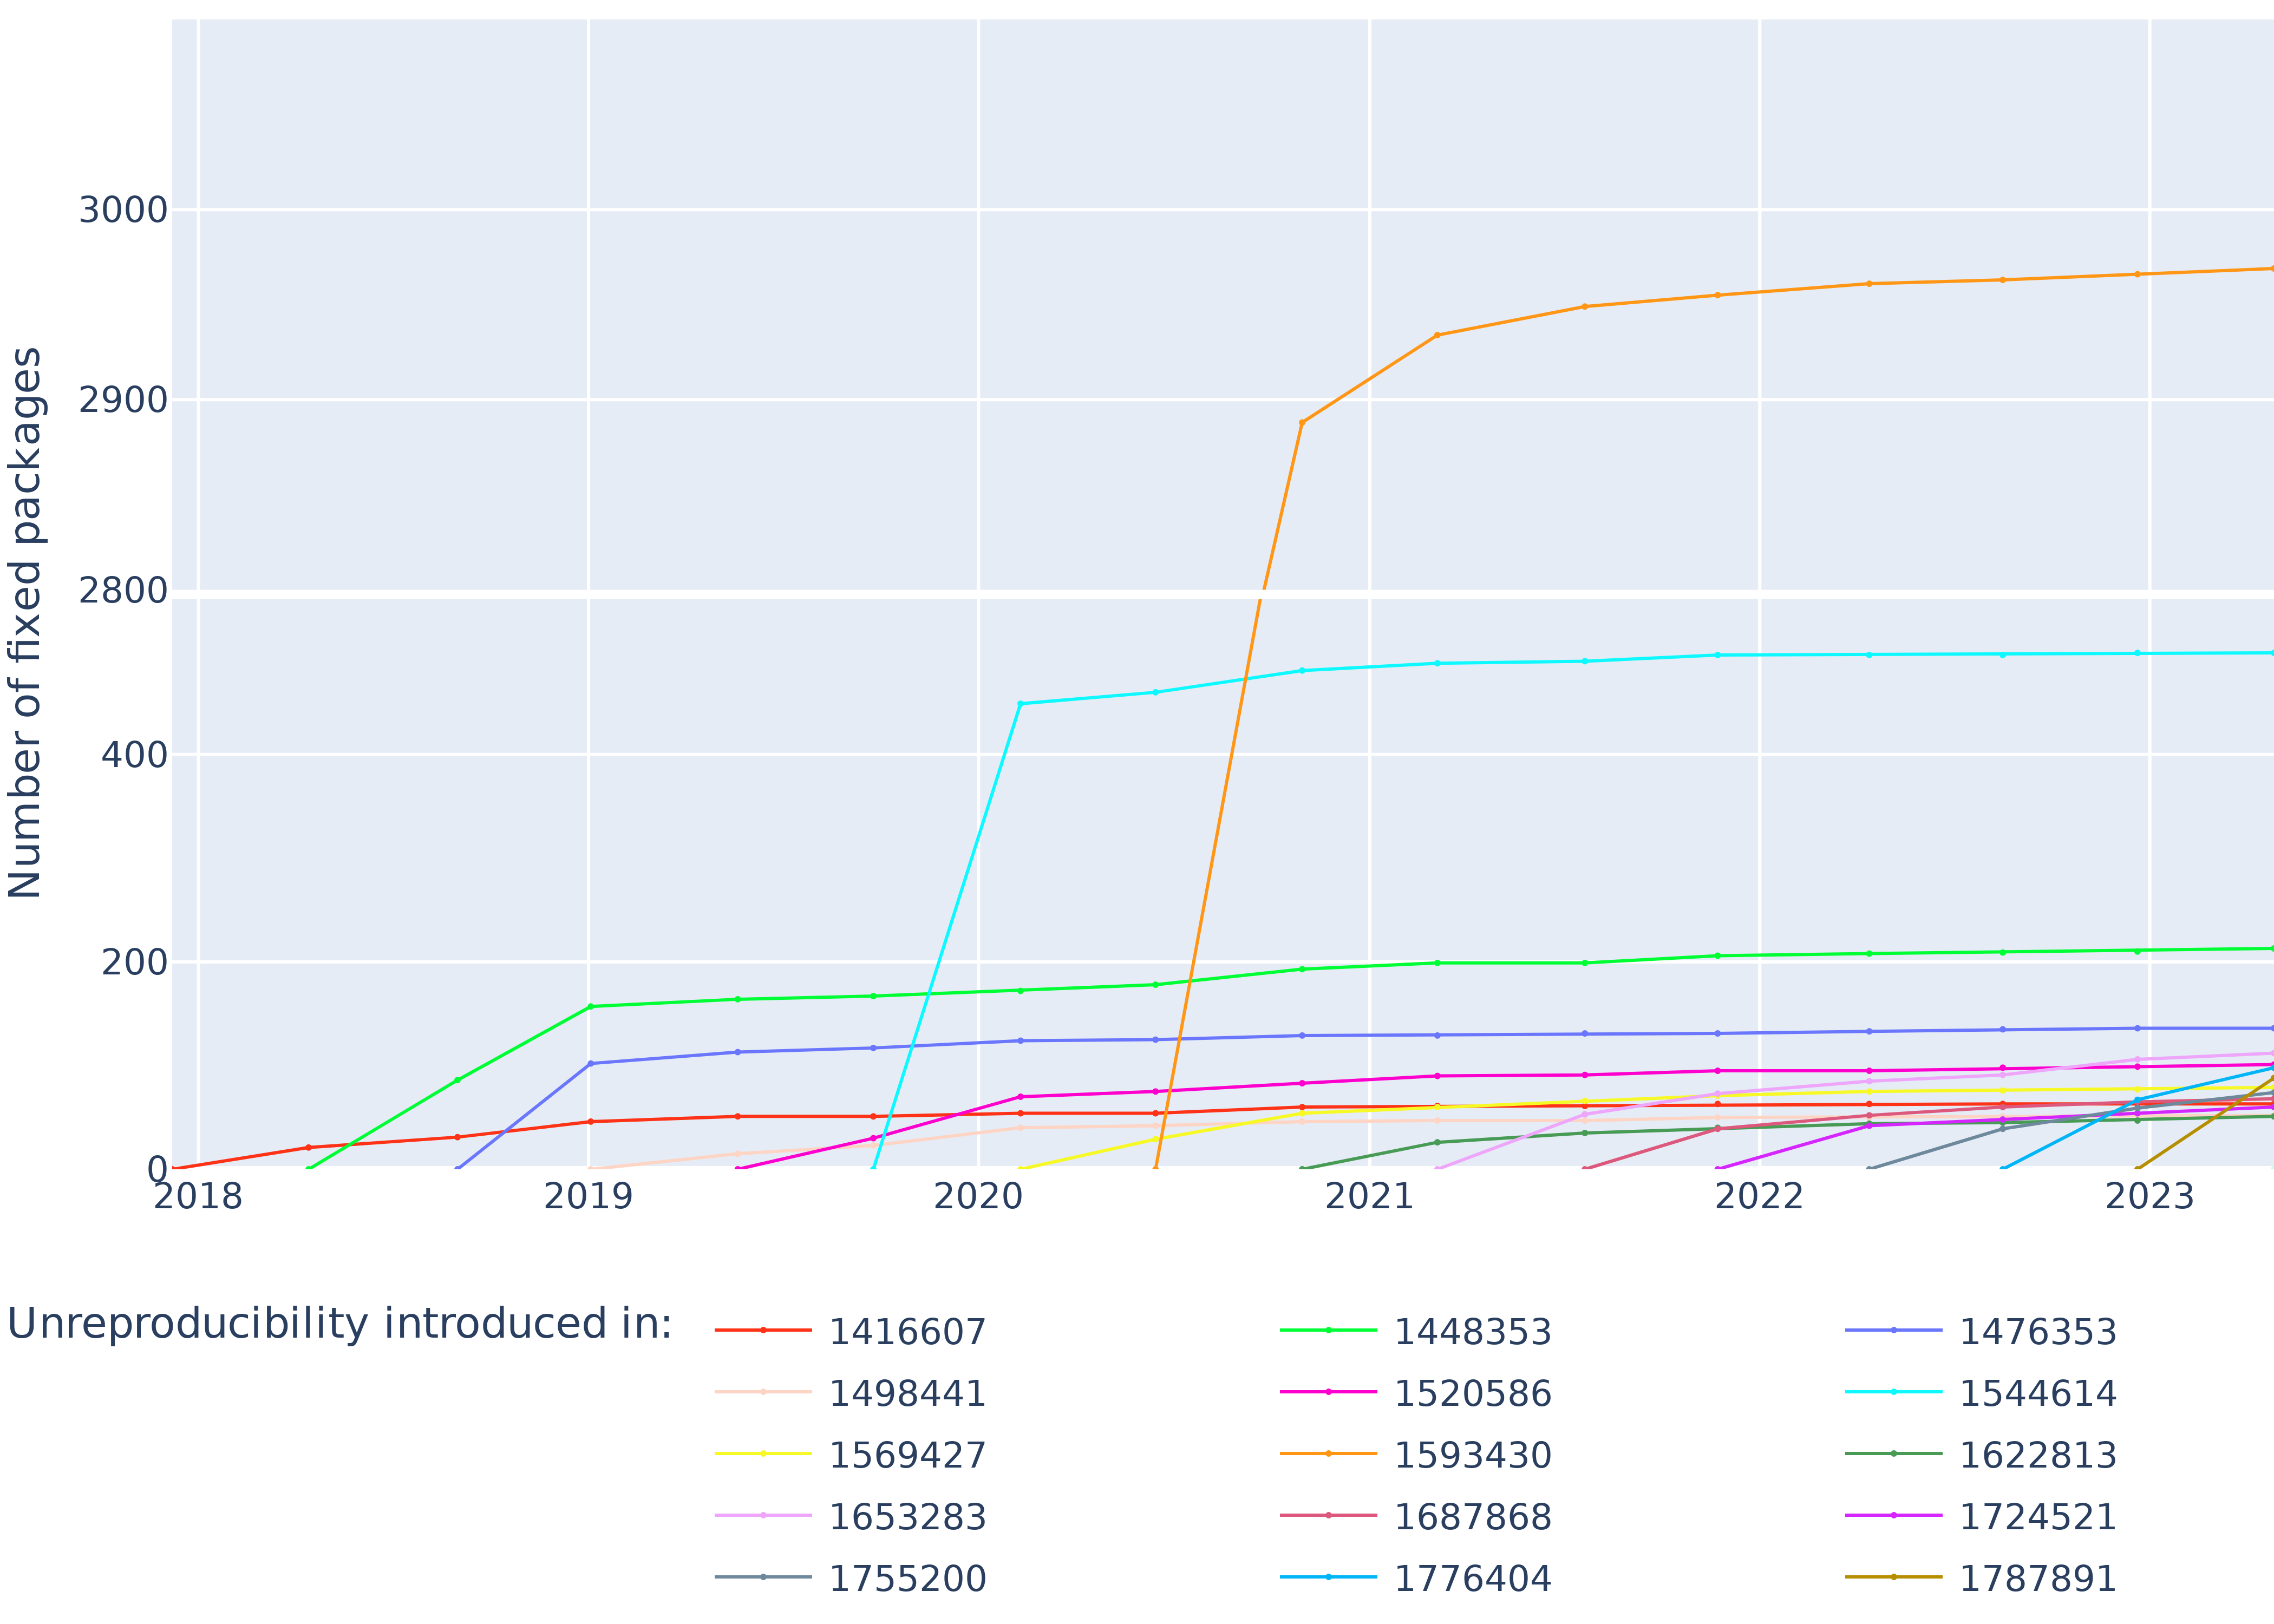
This line chart displays the number of packages fixed over time (2018-2023) due to unreproducibility issues introduced by specific commits. Each line represents a different commit ID, and the y-axis shows the number of packages fixed. The x-axis represents the year.
### Components/Axes
* **X-axis:** Year (2018, 2019, 2020, 2021, 2022, 2023)
* **Y-axis:** Number of fixed packages (Scale: 0 to 3000, increments of 400)
* **Legend:** Located at the bottom of the chart, listing commit IDs and corresponding line colors.
* 1416607 (Red)
* 1498441 (Purple)
* 1569427 (Green)
* 1653283 (Pink)
* 1755200 (Teal)
* 1448353 (Orange)
* 1520586 (Blue)
* 1593430 (Light Green)
* 1687868 (Brown)
* 1776404 (Dark Blue)
* 1476353 (Cyan)
* 1544614 (Magenta)
* 1622813 (Yellow)
* 1724521 (Grey)
* 1787891 (Gold)
### Detailed Analysis
Here's a breakdown of each line's trend and approximate data points:
* **1416607 (Red):** Starts at approximately 0 in 2018, rises sharply to around 3100 in 2020, then declines to approximately 100 in 2023.
* **1498441 (Purple):** Remains relatively flat around 100-200 from 2018 to 2023.
* **1569427 (Green):** Starts at 0 in 2018, increases to around 400 in 2021, then declines to approximately 100 in 2023.
* **1653283 (Pink):** Starts at 0 in 2018, increases to around 200 in 2020, remains relatively flat around 200-300 until 2023.
* **1755200 (Teal):** Starts at 0 in 2018, rises to around 200 in 2019, then declines to approximately 0 in 2023.
* **1448353 (Orange):** Starts at 0 in 2018, increases rapidly to around 2800 in 2020, then declines to approximately 100 in 2023.
* **1520586 (Blue):** Remains relatively flat around 100-200 from 2018 to 2023.
* **1593430 (Light Green):** Starts at 0 in 2018, increases to around 400 in 2021, then declines to approximately 0 in 2023.
* **1687868 (Brown):** Starts at 0 in 2018, increases to around 200 in 2020, remains relatively flat around 200-300 until 2023.
* **1776404 (Dark Blue):** Remains relatively flat around 100-200 from 2018 to 2023.
* **1476353 (Cyan):** Starts at 0 in 2018, increases to around 200 in 2020, then declines to approximately 0 in 2023.
* **1544614 (Magenta):** Remains relatively flat around 100-200 from 2018 to 2023.
* **1622813 (Yellow):** Starts at 0 in 2018, increases to around 3000 in 2020, then declines to approximately 100 in 2023.
* **1724521 (Grey):** Remains relatively flat around 100-200 from 2018 to 2023.
* **1787891 (Gold):** Starts at 0 in 2018, increases to around 2800 in 2020, then declines to approximately 100 in 2023.
### Key Observations
* There's a significant spike in the number of fixed packages around 2020 for several commit IDs (1416607, 1448353, 1622813, 1787891).
* Most lines show a decreasing trend after 2020, suggesting that the initial impact of these commits was addressed.
* Some commit IDs (1498441, 1520586, 1776404, 1544614, 1724521) have a consistently low number of fixed packages throughout the period.
### Interpretation
The chart illustrates the impact of specific commits on package reproducibility. The large increase in fixed packages around 2020 suggests that these commits introduced significant reproducibility issues that required substantial effort to resolve. The subsequent decline in fixed packages indicates that the issues were largely addressed over time. The commits with consistently low numbers of fixed packages may represent changes that had minimal impact on reproducibility or were already well-managed. The data suggests a concentrated effort to address reproducibility problems in the 2020 timeframe, followed by a period of stabilization. The varying magnitudes of the spikes indicate that some commits were more problematic than others. The fact that most lines converge towards zero by 2023 suggests that the initial wave of reproducibility issues has been largely resolved, but ongoing maintenance is still required (as evidenced by the small, non-zero values for some commits).