## Line Chart: Unreproducibility Introduced in Various IDs Over Time
### Overview
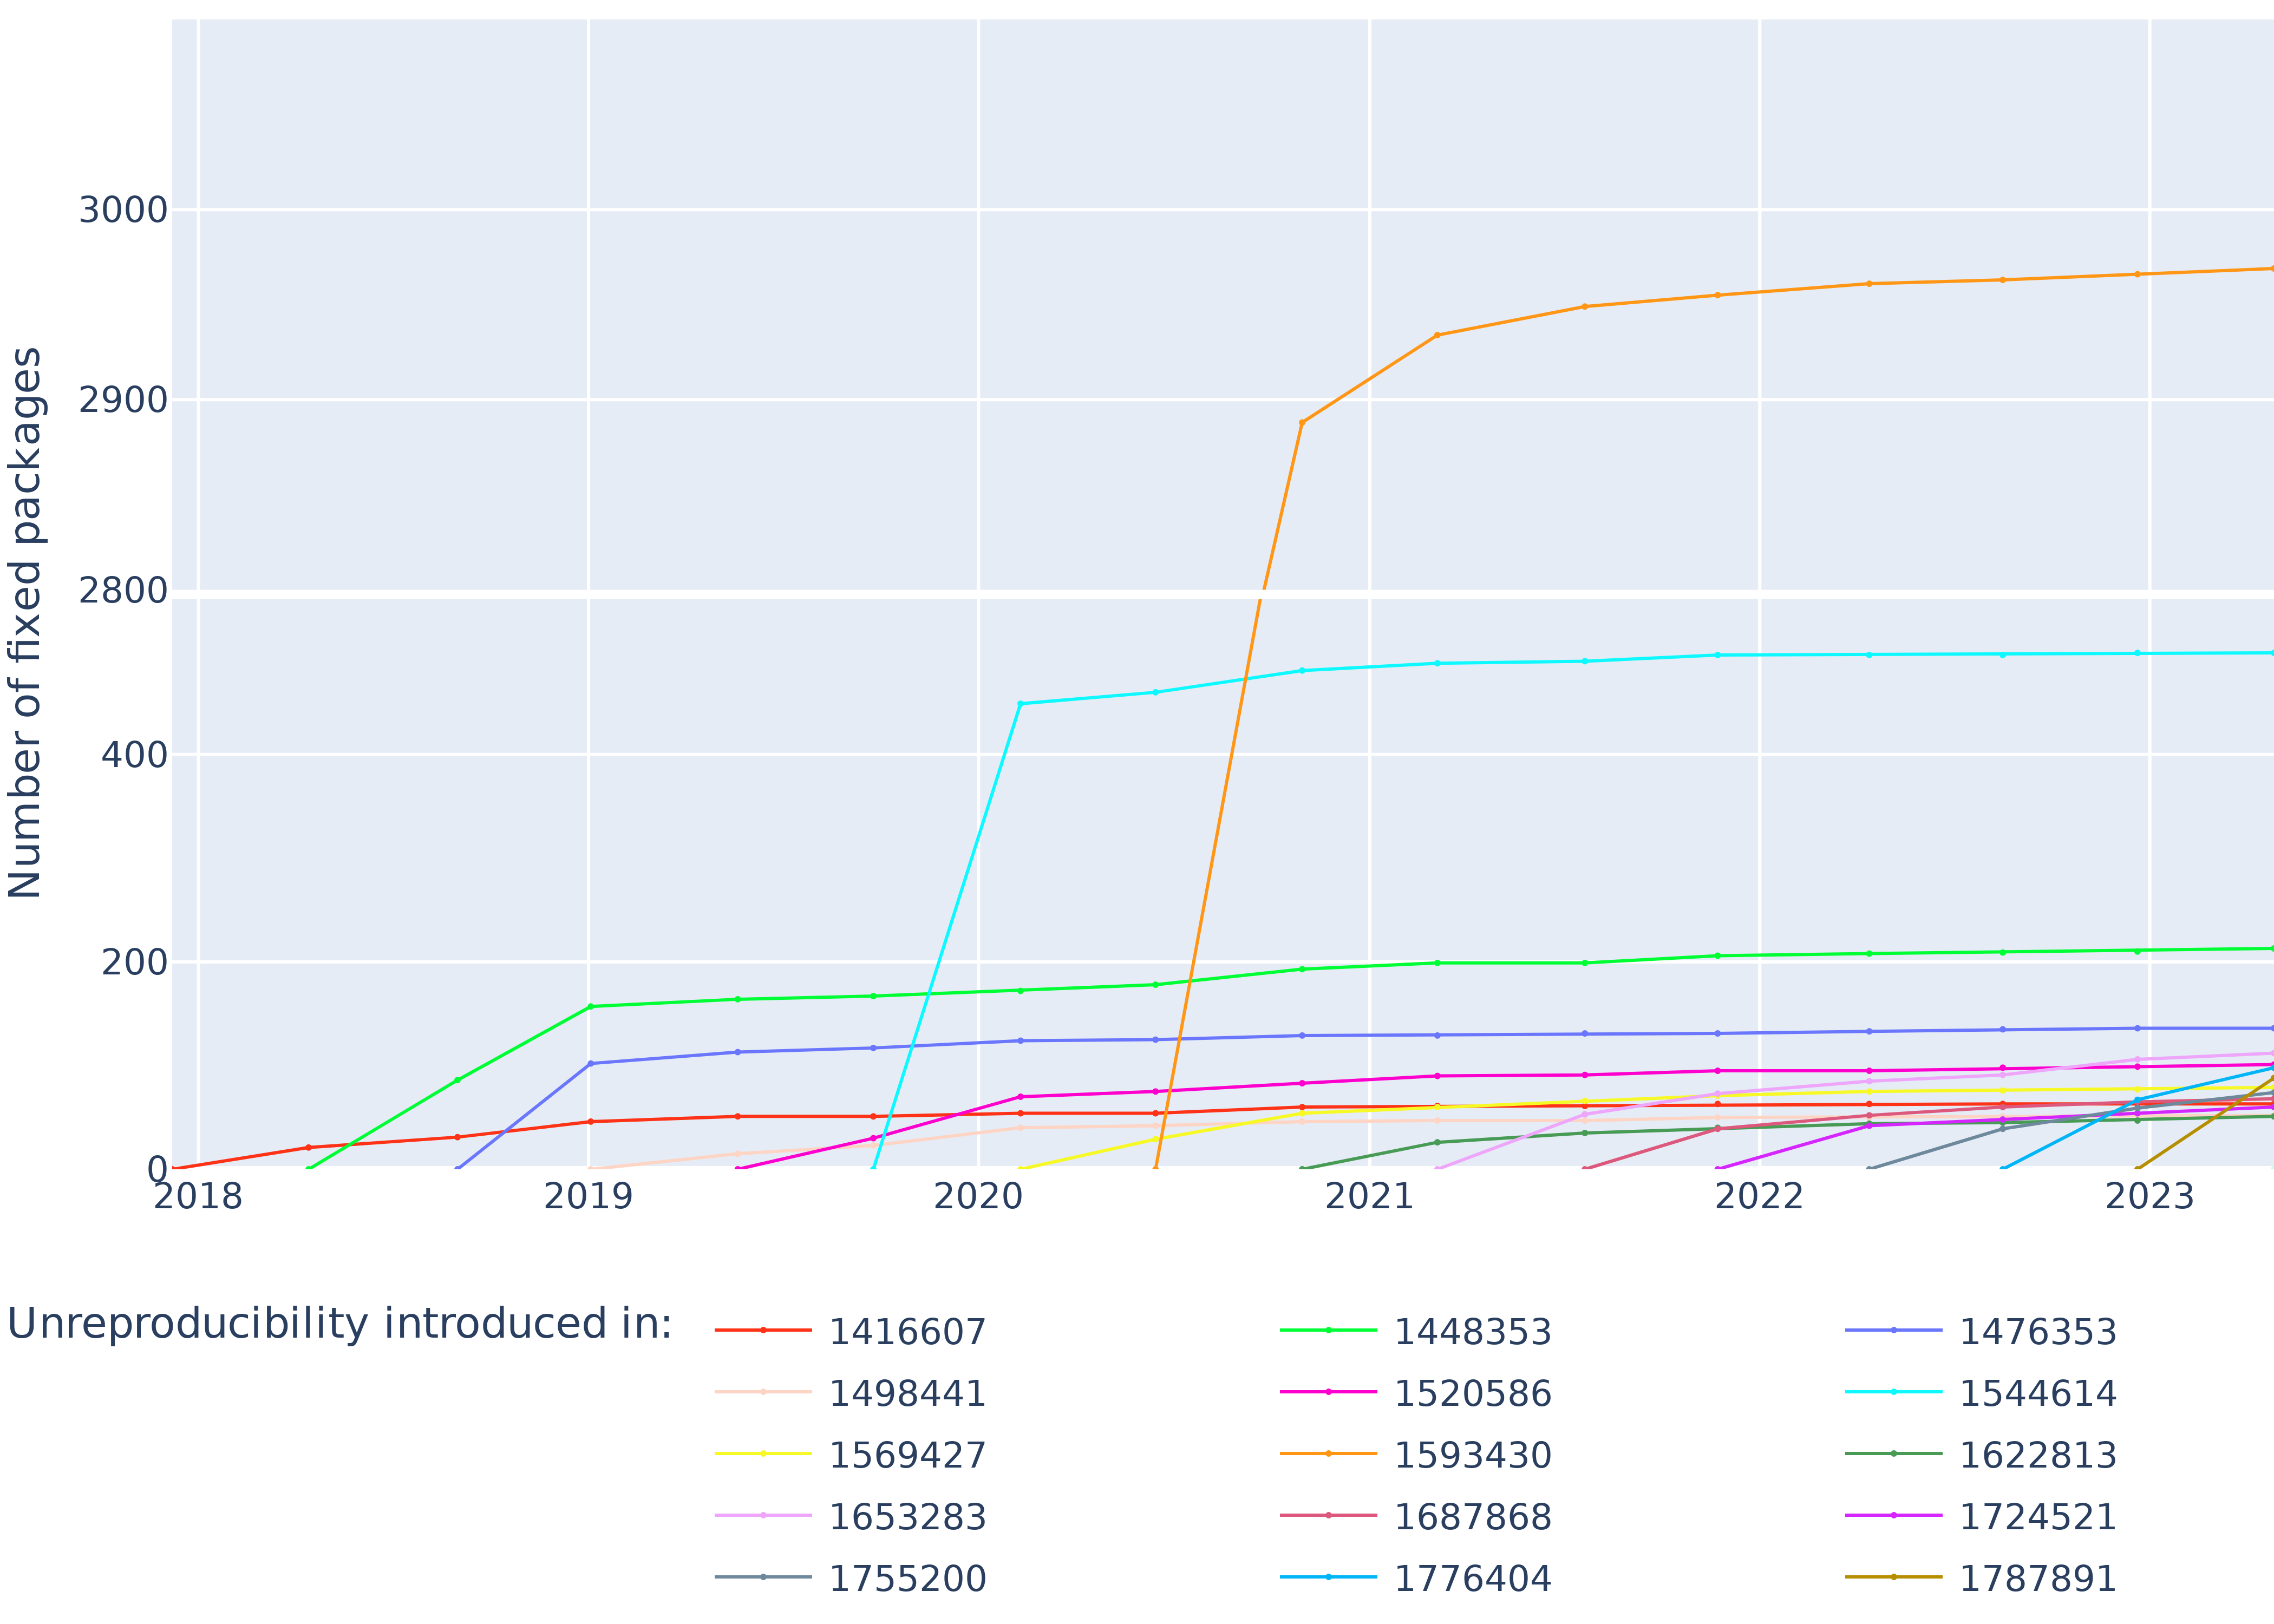
The chart visualizes the number of fixed packages (y-axis) introduced in 12 distinct software IDs (x-axis) from 2018 to 2023. Each ID is represented by a unique colored line, with values plotted annually. The y-axis ranges from 0 to 3,000, while the x-axis spans 2018–2023. The legend at the bottom maps colors to IDs, and the title explicitly states the focus on "Unreproducibility introduced in:".
---
### Components/Axes
- **X-Axis (Years)**: 2018, 2019, 2020, 2021, 2022, 2023 (discrete intervals).
- **Y-Axis (Number of Fixed Packages)**: Linear scale from 0 to 3,000.
- **Legend**: 12 entries, each with a color and ID (e.g., red = 1416607, orange = 1593430). Positioned at the bottom-center.
- **Lines**: 12 colored lines, each corresponding to an ID. Lines are plotted with markers at yearly intervals.
---
### Detailed Analysis
#### Key Trends:
1. **ID 1593430 (Orange Line)**:
- **Trend**: Sharp increase from 0 in 2018 to 2,900 in 2021, then gradual rise to 3,000 by 2023.
- **Notable**: Largest absolute increase (3,000 packages) and most volatile trend.
2. **ID 1544614 (Cyan Line)**:
- **Trend**: Steady rise from 450 in 2020 to 750 in 2023.
- **Notable**: Consistent upward trajectory without plateaus.
3. **ID 1448353 (Green Line)**:
- **Trend**: Gradual increase from 150 in 2019 to 210 in 2023.
- **Notable**: Slow but steady growth.
4. **ID 1476353 (Blue Line)**:
- **Trend**: Increase from 100 in 2019 to 150 in 2023.
- **Notable**: Moderate growth with minor fluctuations.
5. **ID 1724521 (Purple Line)**:
- **Trend**: Rise from 50 in 2020 to 120 in 2023.
- **Notable**: Accelerated growth post-2021.
6. **ID 1622813 (Dark Green Line)**:
- **Trend**: Increase from 180 in 2021 to 220 in 2023.
- **Notable**: Steady but modest growth.
7. **ID 1416607 (Red Line)**:
- **Trend**: Increase from 20 in 2018 to 100 in 2023.
- **Notable**: Slow but consistent growth.
8. **ID 1520586 (Pink Line)**:
- **Trend**: Rise from 50 in 2020 to 120 in 2023.
- **Notable**: Similar trajectory to ID 1724521.
9. **ID 1687868 (Brown Line)**:
- **Trend**: Increase from 20 in 2022 to 90 in 2023.
- **Notable**: Rapid growth in final years.
10. **ID 1755200 (Gray Line)**:
- **Trend**: Increase from 10 in 2022 to 80 in 2023.
- **Notable**: Sharp rise in final years.
11. **ID 1653283 (Light Blue Line)**:
- **Trend**: Increase from 20 in 2022 to 100 in 2023.
- **Notable**: Rapid growth in final years.
12. **ID 1787891 (Dark Orange Line)**:
- **Trend**: Increase from 50 in 2022 to 120 in 2023.
- **Notable**: Accelerated growth post-2022.
---
### Key Observations
- **Dominant Trends**:
- ID 1593430 (orange) and ID 1544614 (cyan) show the most significant increases, suggesting systemic issues in these IDs.
- IDs introduced after 2020 (e.g., 1687868, 1755200) exhibit rapid growth, indicating potential late-stage vulnerabilities.
- **Anomalies**:
- ID 1593430’s spike in 2021 (2,900 packages) is an outlier compared to other IDs.
- IDs with later introduction dates (e.g., 1687868, 1755200) show steeper slopes, possibly reflecting newer codebases with unresolved issues.
---
### Interpretation
The chart highlights **systemic unreproducibility** in software development, with certain IDs (e.g., 1593430, 1544614) contributing disproportionately to fixed packages over time. The sharp rise in ID 1593430 in 2021 suggests a critical event (e.g., major refactoring, bug discovery) that required extensive fixes. IDs introduced later (e.g., 1687868, 1755200) show rapid growth, implying that newer codebases may inherit or introduce vulnerabilities more aggressively. The gradual increases in older IDs (e.g., 1416607, 1448353) reflect ongoing maintenance challenges. This data underscores the need for proactive code quality measures and targeted debugging efforts for high-risk IDs.