## Bar Chart: Accuracy Rate Comparison
### Overview
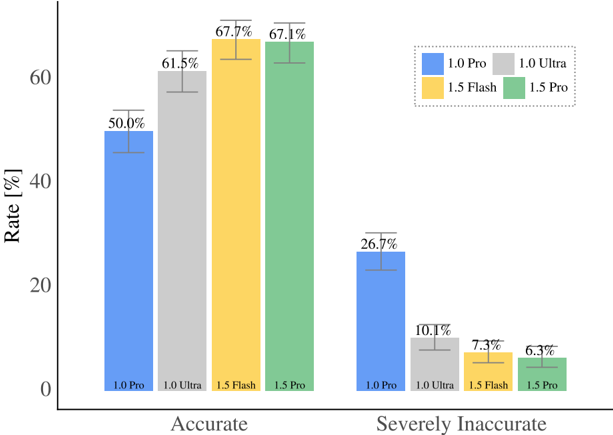
The image is a bar chart comparing the accuracy rates of four different models (1.0 Pro, 1.0 Ultra, 1.5 Flash, and 1.5 Pro) across two categories: "Accurate" and "Severely Inaccurate". The chart displays the percentage rate on the y-axis and the model types on the x-axis. Error bars are present on each bar, indicating variability.
### Components/Axes
* **Y-axis:** "Rate [%]", with a scale from 0 to 60.
* **X-axis:** Two categories: "Accurate" and "Severely Inaccurate". Each category has four bars representing the four models.
* **Legend:** Located in the top-right corner, enclosed in a dotted-line box. The legend maps colors to models:
* Blue: 1.0 Pro
* Gray: 1.0 Ultra
* Yellow: 1.5 Flash
* Green: 1.5 Pro
### Detailed Analysis or ### Content Details
**Accurate Category:**
* **1.0 Pro (Blue):** 50.0%
* Trend: The "1.0 Pro" model has an accuracy rate of 50.0%.
* **1.0 Ultra (Gray):** 61.5%
* Trend: The "1.0 Ultra" model has an accuracy rate of 61.5%.
* **1.5 Flash (Yellow):** 67.7%
* Trend: The "1.5 Flash" model has an accuracy rate of 67.7%.
* **1.5 Pro (Green):** 67.1%
* Trend: The "1.5 Pro" model has an accuracy rate of 67.1%.
**Severely Inaccurate Category:**
* **1.0 Pro (Blue):** 26.7%
* Trend: The "1.0 Pro" model has a severe inaccuracy rate of 26.7%.
* **1.0 Ultra (Gray):** 10.1%
* Trend: The "1.0 Ultra" model has a severe inaccuracy rate of 10.1%.
* **1.5 Flash (Yellow):** 7.3%
* Trend: The "1.5 Flash" model has a severe inaccuracy rate of 7.3%.
* **1.5 Pro (Green):** 6.3%
* Trend: The "1.5 Pro" model has a severe inaccuracy rate of 6.3%.
### Key Observations
* The "Accurate" rates are significantly higher than the "Severely Inaccurate" rates for all models.
* The "1.0 Pro" model has the lowest accuracy rate and the highest severe inaccuracy rate compared to the other models.
* The "1.5 Flash" and "1.5 Pro" models have the highest accuracy rates and the lowest severe inaccuracy rates.
* The error bars indicate some variability in the rates, but the overall trends are clear.
### Interpretation
The data suggests that the "1.5 Flash" and "1.5 Pro" models are more accurate than the "1.0 Pro" and "1.0 Ultra" models. The "1.0 Pro" model appears to be the least accurate, with a significantly higher rate of severe inaccuracies. The models "1.5 Flash" and "1.5 Pro" are very similar in performance. The chart highlights the relative performance differences between these models in terms of accuracy and severe inaccuracy.