## Bar Chart: Accuracy Rates of Different Models
### Overview
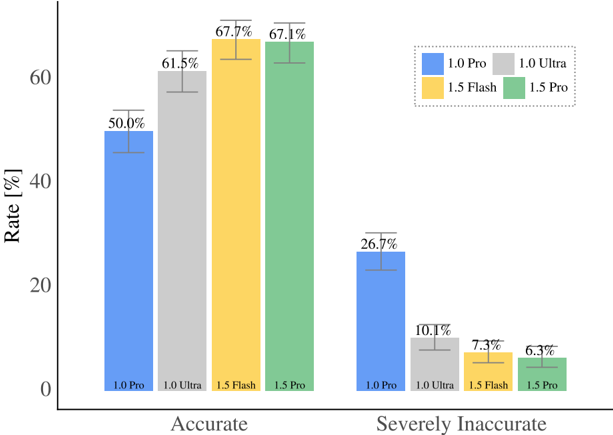
This bar chart compares the accuracy rates of four different models – 1.0 Pro, 1.0 Ultra, 1.5 Flash, and 1.5 Pro – under two conditions: "Accurate" and "Severely Inaccurate". The chart uses bar heights to represent the rate (in percentage) for each model and condition, with error bars indicating variability.
### Components/Axes
* **X-axis:** Categorical, representing the combination of model and accuracy condition. The categories are: "1.0 Pro Accurate", "1.0 Ultra Accurate", "1.5 Flash Accurate", "1.5 Pro Accurate", "1.0 Pro Severely Inaccurate", "1.0 Ultra Severely Inaccurate", "1.5 Flash Severely Inaccurate", "1.5 Pro Severely Inaccurate".
* **Y-axis:** Numerical, labeled "Rate [%]", representing the percentage rate. The scale ranges from 0 to 70, with increments of 10.
* **Legend:** Located in the top-right corner, identifying the color coding for each model:
* Blue: 1.0 Pro
* Gray: 1.0 Ultra
* Yellow: 1.5 Flash
* Green: 1.5 Pro
### Detailed Analysis
The chart consists of two groups of four bars each, separated by a vertical gap. The left group represents "Accurate" results, and the right group represents "Severely Inaccurate" results. Each bar has an associated error bar indicating the standard error or confidence interval.
**Accurate Results:**
* **1.0 Pro (Blue):** The bar height is approximately 50.0%, with an error bar extending roughly from 42% to 58%.
* **1.0 Ultra (Gray):** The bar height is approximately 61.5%, with an error bar extending roughly from 53% to 70%.
* **1.5 Flash (Yellow):** The bar height is approximately 67.7%, with an error bar extending roughly from 60% to 75%.
* **1.5 Pro (Green):** The bar height is approximately 67.1%, with an error bar extending roughly from 60% to 74%.
**Severely Inaccurate Results:**
* **1.0 Pro (Blue):** The bar height is approximately 26.7%, with an error bar extending roughly from 20% to 33%.
* **1.0 Ultra (Gray):** The bar height is approximately 10.1%, with an error bar extending roughly from 6% to 14%.
* **1.5 Flash (Yellow):** The bar height is approximately 7.3%, with an error bar extending roughly from 4% to 11%.
* **1.5 Pro (Green):** The bar height is approximately 6.3%, with an error bar extending roughly from 3% to 9%.
### Key Observations
* For "Accurate" results, 1.5 Flash and 1.5 Pro have the highest rates, both around 67%, and are statistically indistinguishable given the error bars. 1.0 Pro has the lowest rate, at 50%.
* For "Severely Inaccurate" results, all models have low rates, but 1.0 Pro has the highest rate at 26.7%, while 1.5 Flash and 1.5 Pro have the lowest rates, around 7%.
* The difference in rates between "Accurate" and "Severely Inaccurate" is most pronounced for 1.0 Pro, suggesting it is more prone to severe inaccuracies than the other models.
### Interpretation
The data suggests that models 1.5 Flash and 1.5 Pro are generally more accurate and less prone to severe inaccuracies compared to models 1.0 Pro and 1.0 Ultra. The substantial difference in rates between the "Accurate" and "Severely Inaccurate" categories for each model indicates the models' ability to distinguish between correct and incorrect results. The large drop in accuracy for 1.0 Pro when moving from "Accurate" to "Severely Inaccurate" suggests a potential weakness in its robustness or sensitivity to certain types of input. The error bars indicate the variability in the results, and the overlap between error bars for some models suggests that the differences in their rates may not be statistically significant. Overall, the chart provides a comparative assessment of the performance of different models in terms of accuracy and the likelihood of severe errors.