\n
## Bar Chart: Model Accuracy Comparison
### Overview
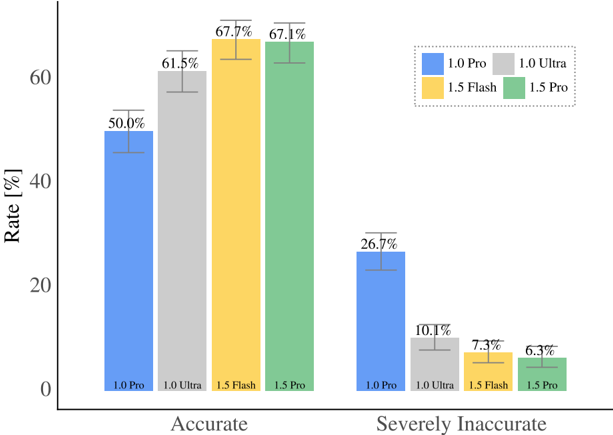
This is a grouped bar chart comparing the performance of four different models (1.0 Pro, 1.0 Ultra, 1.5 Flash, 1.5 Pro) across two performance categories: "Accurate" and "Severely Inaccurate". The chart displays the rate (in percentage) for each model within each category, including error bars indicating variability.
### Components/Axes
* **Chart Type:** Grouped bar chart with error bars.
* **Y-Axis:** Labeled "Rate [%]". The scale runs from 0 to 60, with major tick marks at 0, 20, 40, and 60.
* **X-Axis:** Contains two primary category labels: "Accurate" (left group) and "Severely Inaccurate" (right group).
* **Legend:** Located in the top-right corner of the chart area, enclosed in a dashed box. It maps colors to model names:
* Blue square: `1.0 Pro`
* Gray square: `1.0 Ultra`
* Yellow square: `1.5 Flash`
* Green square: `1.5 Pro`
* **Data Series:** Four bars per category, corresponding to the four models. Each bar has a numerical percentage label at its top and an error bar (T-shaped line) extending above it.
### Detailed Analysis
**Category: Accurate (Left Group)**
* **1.0 Pro (Blue Bar):** Rate = 50.0%. The error bar extends from approximately 48% to 52%.
* **1.0 Ultra (Gray Bar):** Rate = 61.5%. The error bar extends from approximately 59% to 64%.
* **1.5 Flash (Yellow Bar):** Rate = 67.7%. The error bar extends from approximately 65% to 70%.
* **1.5 Pro (Green Bar):** Rate = 67.1%. The error bar extends from approximately 65% to 69%.
**Category: Severely Inaccurate (Right Group)**
* **1.0 Pro (Blue Bar):** Rate = 26.7%. The error bar extends from approximately 24% to 29%.
* **1.0 Ultra (Gray Bar):** Rate = 10.1%. The error bar extends from approximately 8% to 12%.
* **1.5 Flash (Yellow Bar):** Rate = 7.3%. The error bar extends from approximately 6% to 9%.
* **1.5 Pro (Green Bar):** Rate = 6.3%. The error bar extends from approximately 5% to 8%.
### Key Observations
1. **Inverse Relationship:** There is a clear inverse trend between the "Accurate" and "Severely Inaccurate" rates for each model. Models with higher accuracy rates have lower severe inaccuracy rates.
2. **Model Progression:** The newer model series (1.5 Flash and 1.5 Pro) consistently outperform the older series (1.0 Pro and 1.0 Ultra) in both metrics. They show higher accuracy and lower severe inaccuracy.
3. **Top Performer:** The `1.5 Pro` model achieves the highest accuracy rate (67.1%) and the lowest severe inaccuracy rate (6.3%).
4. **Error Bar Consistency:** The error bars for the 1.5 series models in the "Severely Inaccurate" category are notably smaller in absolute terms compared to the 1.0 series, suggesting more consistent performance in avoiding severe errors.
5. **Significant Drop:** The `1.0 Pro` model has a particularly high rate of severe inaccuracy (26.7%) compared to the others, which is more than four times the rate of the `1.5 Pro`.
### Interpretation
The data demonstrates a clear generational improvement in model performance. The transition from the 1.0 series to the 1.5 series yields substantial gains in reliability, characterized by both an increased likelihood of accurate outputs and a dramatically reduced risk of severely inaccurate ones.
The near-identical accuracy rates of `1.5 Flash` (67.7%) and `1.5 Pro` (67.1%) are noteworthy. This suggests that the "Flash" variant may be optimized for a favorable balance of speed and accuracy, achieving results comparable to the "Pro" variant in this specific metric. However, the `1.5 Pro` model shows a slight edge in minimizing severe errors (6.3% vs. 7.3%), indicating it may be the more robust choice for applications where avoiding catastrophic failures is critical.
The high severe inaccuracy rate of the `1.0 Pro` model (26.7%) highlights a significant weakness in that version, making it potentially unsuitable for high-stakes tasks. The chart effectively argues for the adoption of the 1.5 series models, particularly the `1.5 Pro`, for tasks requiring both high accuracy and high reliability.