# Technical Document Extraction: Line Graph Analysis
## 1. **Axis Labels and Titles**
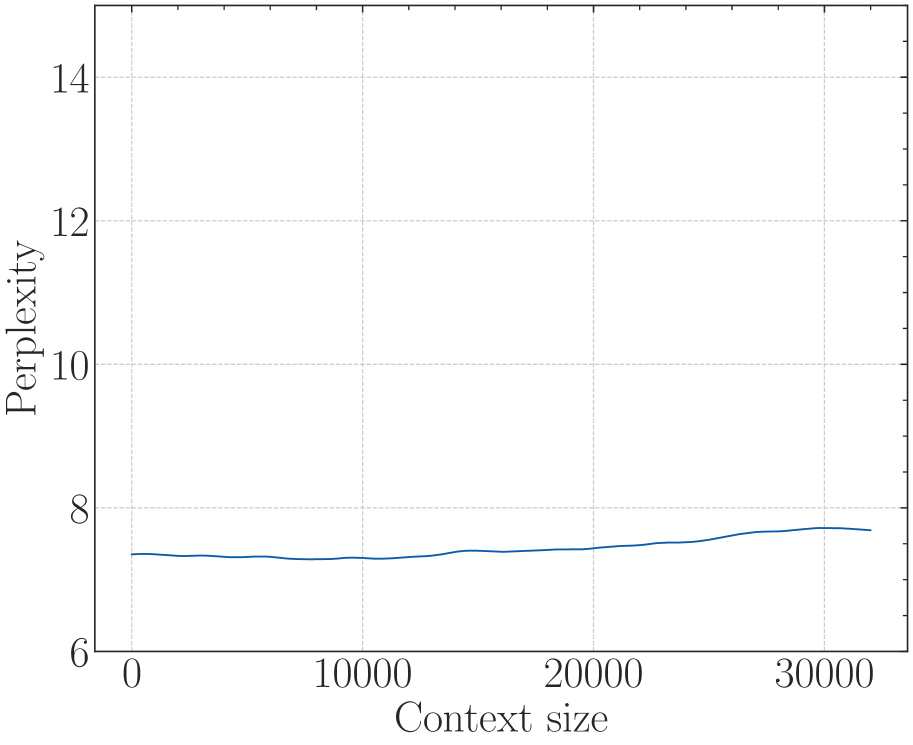
- **Y-Axis**: Labeled "Perplexity" with numerical markers at intervals of 2 (6, 8, 10, 12, 14).
- **X-Axis**: Labeled "Context size" with numerical markers at intervals of 10,000 (0, 10,000, 20,000, 30,000).
## 2. **Legend and Color Mapping**
- **Legend**: No explicit legend is visible in the image. However, the single data series is represented by a **blue line**, which would typically correspond to a legend entry (e.g., "Data Series 1" or similar). Spatial grounding of a legend is not applicable here due to its absence.
## 3. **Data Points and Trends**
- **Key Data Points**:
- At **x = 0**: Perplexity ≈ 7.2.
- At **x = 10,000**: Perplexity ≈ 7.0 (slight dip).
- At **x = 30,000**: Perplexity ≈ 7.8 (gradual increase).
- **Trend Verification**:
- The line exhibits a **slight downward trend** from x = 0 to x = 10,000, followed by a **gradual upward trend** from x = 10,000 to x = 30,000. The fluctuations are minor, with no sharp peaks or troughs.
## 4. **Chart Components**
- **Grid**: Dotted gridlines for reference, spanning the entire plot area.
- **Line Style**: Smooth, continuous blue line with no markers or annotations.
## 5. **Component Isolation**
- **Main Chart**: Dominates the image, occupying ~90% of the space. No header or footer elements are present.
## 6. **Textual Content**
- No embedded text, annotations, or data tables are visible in the image.
## 7. **Language and Transcription**
- All text is in **English**. No non-English content detected.
## 8. **Final Notes**
- The graph illustrates a relationship between "Context size" (x-axis) and "Perplexity" (y-axis), with a net increase in perplexity over the observed range despite an initial dip. No additional contextual or categorical data is provided.