\n
## Histogram: Neuron Activation Distribution
### Overview
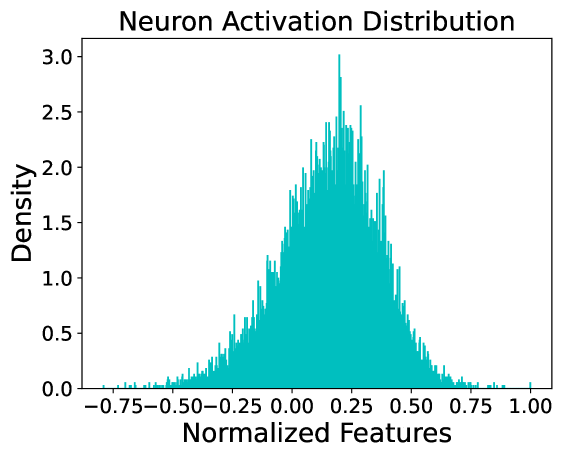
The image presents a histogram visualizing the distribution of neuron activations. The x-axis represents "Normalized Features," and the y-axis represents "Density." The histogram is filled with a teal color.
### Components/Axes
* **Title:** "Neuron Activation Distribution" - positioned at the top-center of the image.
* **X-axis Label:** "Normalized Features" - positioned along the bottom of the image. The scale ranges from approximately -0.75 to 1.00, with markings at -0.75, -0.50, -0.25, 0.00, 0.25, 0.50, 0.75, and 1.00.
* **Y-axis Label:** "Density" - positioned along the left side of the image. The scale ranges from 0.0 to 3.0, with markings at 0.0, 0.5, 1.0, 1.5, 2.0, 2.5, and 3.0.
* **Data Series:** A single histogram series, colored teal.
### Detailed Analysis
The histogram shows a roughly symmetrical distribution, peaking around a normalized feature value of approximately 0.25. The density at this peak is around 2.6.
Here's a breakdown of approximate density values at specific normalized feature values:
* At -0.75: Density is approximately 0.02
* At -0.50: Density is approximately 0.1
* At -0.25: Density is approximately 0.6
* At 0.00: Density is approximately 1.4
* At 0.25: Density is approximately 2.6
* At 0.50: Density is approximately 1.6
* At 0.75: Density is approximately 0.4
* At 1.00: Density is approximately 0.03
The distribution appears to have two smaller peaks or shoulders around -0.25 and 0.50, with densities around 1.8 and 1.5 respectively. The histogram exhibits a relatively smooth shape with some minor fluctuations.
### Key Observations
* The distribution is unimodal, with a clear primary peak.
* The distribution is approximately symmetrical, though slightly skewed to the right.
* The majority of neuron activations fall within the range of -0.5 to 0.75.
* There is a relatively low density of activations at the extreme ends of the normalized feature range (-0.75 and 1.0).
### Interpretation
The histogram suggests that the neuron activations are centered around a normalized feature value of 0.25. The distribution's shape indicates that activations are relatively common near this value and become less frequent as you move away from it in either direction. This could indicate that the neuron responds most strongly to inputs with a normalized feature value around 0.25. The symmetry suggests a balanced response to positive and negative deviations from this optimal value. The relatively low density at the extremes suggests that very low or very high feature values are less likely to trigger strong activations in this neuron. The presence of smaller shoulders could indicate the presence of secondary activation patterns or the influence of other factors on the neuron's response.