## Histogram: Neuron Activation Distribution
### Overview
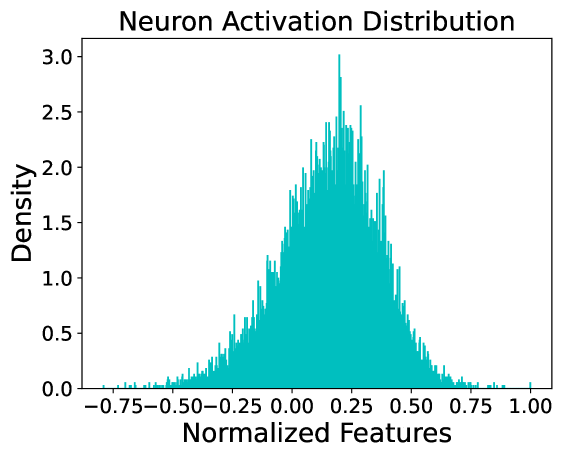
The image displays a histogram titled "Neuron Activation Distribution." It visualizes the frequency distribution of normalized feature values, likely representing the activation levels of neurons in a neural network or a similar computational model. The chart uses a single, dense series of teal-colored bars to show the density of data points across a range of values.
### Components/Axes
* **Title:** "Neuron Activation Distribution" (centered at the top).
* **X-Axis:**
* **Label:** "Normalized Features" (centered below the axis).
* **Scale & Ticks:** Linear scale ranging from approximately -0.75 to 1.00. Major tick marks are placed at intervals of 0.25: -0.75, -0.50, -0.25, 0.00, 0.25, 0.50, 0.75, 1.00.
* **Y-Axis:**
* **Label:** "Density" (rotated 90 degrees, centered to the left of the axis).
* **Scale & Ticks:** Linear scale ranging from 0.0 to 3.0. Major tick marks are placed at intervals of 0.5: 0.0, 0.5, 1.0, 1.5, 2.0, 2.5, 3.0.
* **Data Series:** A single histogram represented by numerous thin, adjacent teal bars. There is no legend, as only one data category is plotted.
### Detailed Analysis
* **Distribution Shape:** The overall distribution is unimodal (single-peaked) and roughly bell-shaped, but exhibits a slight positive (right) skew. The tail on the right side (positive values) appears slightly longer and more tapered than the tail on the left.
* **Central Tendency & Peak:** The highest density of activations occurs in the bin centered at approximately **0.25** on the x-axis. The peak density value at this point is approximately **3.0**.
* **Spread & Range:** The vast majority of the data falls between **-0.50** and **0.75**. The distribution has a visible but low-density tail extending to the left towards -0.75 and to the right towards 1.00.
* **Density Values:**
* At x = -0.50, density is very low, approximately **0.1**.
* At x = 0.00, density is moderate, approximately **1.8**.
* At x = 0.50, density is still significant, approximately **1.5**.
* At x = 0.75, density drops to a low value, approximately **0.2**.
* **Visual Trend:** The data series shows a clear upward trend from the left tail, accelerating to a sharp peak just past the center (0.25), followed by a more gradual decline towards the right tail.
### Key Observations
1. **Positive Bias:** The center of mass of the distribution is shifted to the right of zero (0.00), with the peak at ~0.25. This indicates that, on average, the normalized neuron activations are positive.
2. **Concentration:** The highest concentration of activation values is within a relatively narrow band between approximately 0.00 and 0.50.
3. **Asymmetry:** The distribution is not perfectly symmetric. The slope ascending to the peak from the left appears slightly steeper than the slope descending to the right.
4. **Outliers:** There are very few data points with normalized feature values below -0.50 or above 0.75, suggesting these are rare activation states.
### Interpretation
This histogram provides a statistical snapshot of neuron behavior within a model. The data suggests that the neurons are, on average, moderately active (positive normalized features), with a strong tendency to cluster around a specific activation level (~0.25). The unimodal, near-normal distribution is typical for many activation functions (like ReLU or tanh) in well-trained networks, indicating stable and predictable behavior.
The slight right skew could imply a few possibilities: a minor bias in the data or model parameters, the influence of a specific activation function that allows for a longer positive tail, or the presence of a small subset of neurons that are highly active. The low density at the extremes (-0.75 and 1.00) confirms that extreme activation states are uncommon. For a technical document, this chart serves to validate that the neuron activations are well-behaved, centered, and not suffering from issues like saturation (where values would cluster at the extremes) or vanishing gradients (which might produce a distribution heavily skewed toward zero).