## Histogram: Neuron Activation Distribution
### Overview
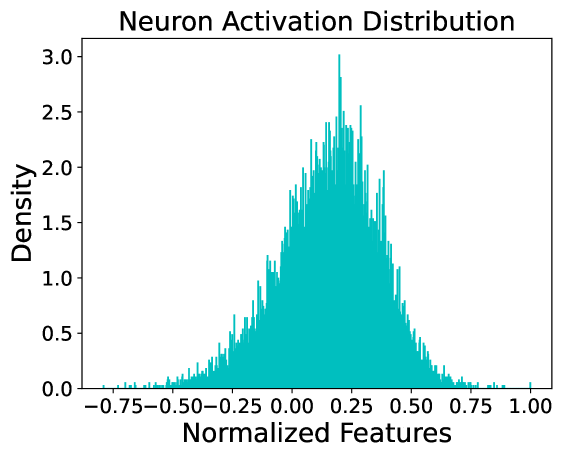
The image displays a histogram representing the distribution of neuron activation values. The chart uses a teal-colored bar plot to visualize the density of normalized feature values across a range from -0.75 to 1.00. The distribution peaks near the center (0.0) and tapers off symmetrically toward both ends.
### Components/Axes
- **Title**: "Neuron Activation Distribution" (top-center, black text).
- **X-axis**: Labeled "Normalized Features," with tick marks at intervals of 0.25 (-0.75, -0.50, -0.25, 0.00, 0.25, 0.50, 0.75, 1.00).
- **Y-axis**: Labeled "Density," with tick marks at intervals of 0.5 (0.0, 0.5, 1.0, 1.5, 2.0, 2.5, 3.0).
- **Legend**: Positioned at the top-right, indicating the teal color corresponds to "Neuron Activation Distribution."
### Detailed Analysis
- **Data Distribution**: The histogram shows a bell-shaped curve, with the highest density (~3.0) centered at 0.0. Density decreases linearly toward both extremes, reaching near-zero values at -0.75 and 1.00.
- **Key Data Points**:
- At -0.75: Density ≈ 0.0.
- At -0.50: Density ≈ 0.1.
- At -0.25: Density ≈ 0.5.
- At 0.00: Density ≈ 3.0 (peak).
- At 0.25: Density ≈ 2.5.
- At 0.50: Density ≈ 1.5.
- At 0.75: Density ≈ 0.3.
- At 1.00: Density ≈ 0.0.
- **Bar Structure**: Bars are evenly spaced along the x-axis, with heights proportional to density values. No gaps or missing data points are observed.
### Key Observations
1. **Symmetry**: The distribution is nearly symmetric around 0.0, suggesting balanced activation patterns.
2. **Peak Dominance**: The majority of neuron activations cluster tightly around the mean (0.0), indicating low variability.
3. **Tapered Extremes**: Very few neurons exhibit extreme activation values (beyond ±0.5).
### Interpretation
The data suggests that neuron activations in this dataset are predominantly centered around a normalized value of 0.0, with a Gaussian-like distribution. This symmetry implies that neural responses are balanced, with minimal skew toward hyper- or hypo-activation states. The sharp decline in density at the extremes (-0.75 and 1.00) indicates that extreme activation events are rare, which could reflect stable neural processing or effective regulatory mechanisms. The absence of outliers reinforces the reliability of the dataset for modeling purposes. The teal color coding aligns with the legend, confirming consistency in data representation.