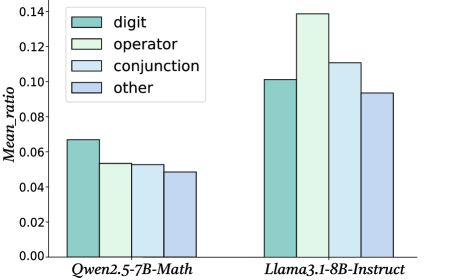
## Bar Chart: Mean Ratio Comparison Across Models
### Overview
The chart compares mean ratios of four categories ("digit," "operator," "conjunction," "other") between two language models: **Qwen2.5-7B-Math** and **Llama3.1-8B-Instruct**. The y-axis represents the mean ratio (0.00–0.14), while the x-axis lists the models. Each model has four grouped bars corresponding to the categories.
### Components/Axes
- **X-axis**: Model names ("Qwen2.5-7B-Math," "Llama3.1-8B-Instruct").
- **Y-axis**: Mean ratio (0.00–0.14, increments of 0.02).
- **Legend**: Located in the top-left corner, mapping colors to categories:
- Teal: digit
- Light green: operator
- Light blue: conjunction
- Purple: other
### Detailed Analysis
#### Qwen2.5-7B-Math
- **Digit**: ~0.065 (teal bar, highest among Qwen's categories).
- **Operator**: ~0.055 (light green bar, second highest).
- **Conjunction**: ~0.053 (light blue bar, third highest).
- **Other**: ~0.048 (purple bar, lowest).
#### Llama3.1-8B-Instruct
- **Digit**: ~0.10 (teal bar, second highest overall).
- **Operator**: ~0.14 (light green bar, highest across all models).
- **Conjunction**: ~0.11 (light blue bar, second highest overall).
- **Other**: ~0.095 (purple bar, slightly higher than Qwen's "other").
### Key Observations
1. **Llama3.1-8B-Instruct** consistently outperforms **Qwen2.5-7B-Math** in all categories except "other," where it is marginally lower.
2. **Operator** is the dominant category for Llama3.1 (~0.14), while **digit** is the weakest for Qwen (~0.065).
3. The "other" category shows the smallest disparity between models (~0.048 vs. ~0.095).
### Interpretation
The data suggests that **Llama3.1-8B-Instruct** excels in operator-based tasks, potentially due to architectural or training differences. Qwen2.5-7B-Math shows stronger performance in digit-related tasks but lags in operator and conjunction categories. The "other" category's lower ratios for both models indicate these tasks are less emphasized or inherently more challenging. The stark difference in operator performance highlights Llama3.1's specialization in complex reasoning, while Qwen's digit focus may reflect optimization for numerical tasks. The "other" category's ambiguity warrants further investigation into its definition and real-world relevance.